Exam 35: Statistical Graphs
Exam 1: Addition10 Questions
Exam 2: Subtraction10 Questions
Exam 3: Multiplication10 Questions
Exam 4: Division10 Questions
Exam 5: Combined Operations10 Questions
Exam 6: Addition10 Questions
Exam 7: Subtraction10 Questions
Exam 8: Multiplication10 Questions
Exam 9: Division10 Questions
Exam 10: Combined Operations10 Questions
Exam 11: Addition10 Questions
Exam 12: Subtraction10 Questions
Exam 13: Multiplication10 Questions
Exam 14: Division11 Questions
Exam 15: Combined Operations10 Questions
Exam 16: Equivalent Decimals and Fractions10 Questions
Exam 17: Percents10 Questions
Exam 18: Simple Interest and Discounts10 Questions
Exam 19: Powers, Roots, and the Pythagorean Theorem10 Questions
Exam 20: Lines, Angles, and Triangles10 Questions
Exam 21: Polygons and Circles10 Questions
Exam 23: Linear Measure10 Questions
Exam 24: Scaled Measurements10 Questions
Exam 25: Area10 Questions
Exam 26: Volume10 Questions
Exam 27: Equivalent Measurement Chapters10 Questions
Exam 28: Angle Measure10 Questions
Exam 29: Expressions and Equations10 Questions
Exam 30: Ratios10 Questions
Exam 31: Proportions10 Questions
Exam 32: Formulas and Handbook Data10 Questions
Exam 33: Averages10 Questions
Exam 34: Coordinate Systems10 Questions
Exam 35: Statistical Graphs10 Questions
Exam 36: Right Triangles10 Questions
Exam 37: Oblique Triangles10 Questions
Exam 38: Estimation and Percent Accuracy10 Questions
Exam 39: Tolerancing and Gdt10 Questions
Select questions type
Use the following graph for problems 3 through 7. This graph represents the percent of drafters employed by a company by type of drafter.  In the graph above, what percent of the drafters are Mechanical?
Free
(Short Answer)
4.9/5  (30)
(30)
Correct Answer: Verified
9%
Use the following graph for problems 8 through 10. This graph represents the number of hours by month spent by company XYZ on special projects. 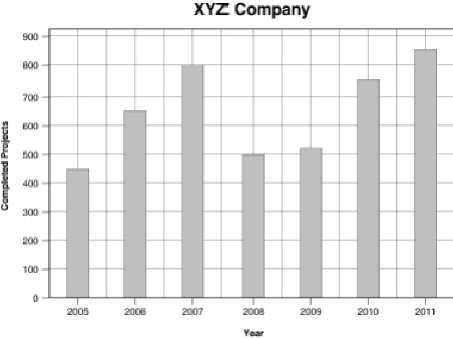 In the graph above, which year had the least completed projects?
Free
(Short Answer)
4.8/5 (26)
Correct Answer:Verified
2005
In the graph above, what percent represents the total architectural, electrical, and civil drafters?
Free
(Short Answer)
4.9/5 (32)
Correct Answer:Verified
78%
In the graph above, if the total number of employees in this company is 1,000, how many employees are electrical drafters?
(Short Answer)
4.7/5 (36)
Bar graphs and line graphs are most often used to compare relationships between two sets of data.
(True/False)
4.8/5 (35)
In the graph above, which type of drafter has the most employees?
(Short Answer)
4.8/5 (27)
Circle graphs are used to display the relationship among parts of a whole.
(True/False)
4.8/5 (41)
In the graph above, which type of drafter has the least employees?
(Short Answer)
4.9/5 (34)
In the graph above, between which two years was there the biggest drop in completed projects?
(Short Answer)
4.8/5 (35)
In the graph above, how many projects were completed for all the years represented in the graph (2005 through 2011)?
(Short Answer)
4.7/5 (42)
Filters
- Essay(0)
- Multiple Choice(0)
- Short Answer(0)
- True False(0)
- Matching(0)