Exam 10: Data Preparation and Basic Analysis
Exam 1: Introducing Social Research30 Questions
Exam 2: Ethics and Social Science Research5 Questions
Exam 3: Scientific Method and Basic Concepts9 Questions
Exam 4: Variables and Their Measurement6 Questions
Exam 5: Designing Social Experiments25 Questions
Exam 6: Ethnography and Observation5 Questions
Exam 7: Indirect Methods5 Questions
Exam 8: Surveys7 Questions
Exam 9: Population, Samples, and Sampling47 Questions
Exam 10: Data Preparation and Basic Analysis5 Questions
Exam 11: Data Analysis 2: Describing, Explaining, Evaluating5 Questions
Exam 12: Preparing the Report5 Questions
Exam 13: Applying Principles of Science Learning to Everyday Learning6 Questions
Select questions type
Use Table 1 to answer the following
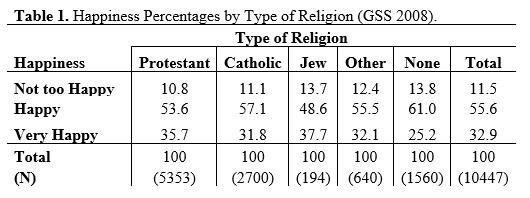 -In Table 1, rounded to whole percentages, the percentage of Jews who are very happy is __%.
Free
(Multiple Choice)
4.8/5  (22)
(22)
Correct Answer: Verified
A
Use Table 1 to answer the following
-Because there are more Protestants than Catholics in the dataset, the percentage results in Table 1, rounded to whole percentages, are
Free
(Multiple Choice)
4.7/5 (42)
Correct Answer:Verified
D
Use Table 1 to answer the following
-In Table 1, rounded to whole percentages, the base (denominator) used to calculate the percentage of those reporting no religion is
Free
(Multiple Choice)
4.9/5 (27)
Correct Answer:Verified
C
Use Table 1 to answer the following
-In Table 1, rounded to whole percentages, the total percentage in this sample that is very happy is
(Multiple Choice)
4.8/5 (29)
Use Table 1 to answer the following
-The research hypothesis for Table 1, rounded to whole percentages, is
(Multiple Choice)
4.9/5 (33)
Filters
- Essay(0)
- Multiple Choice(0)
- Short Answer(0)
- True False(0)
- Matching(0)