Exam 2: Demand Analysis and Estimating Demand
Exam 1: Fundamental Economic Concepts9 Questions
Exam 2: Demand Analysis and Estimating Demand8 Questions
Exam 3: Managing in the Global Economy , Business and Economic Forecasting7 Questions
Exam 4: Production Economics,applications of Cost Theory and Cost Analysis10 Questions
Exam 5: Pricing Techniques and Analysis12 Questions
Exam 6: Differential Calculus Techniques in Management and Long-Term Investment Analysis7 Questions
Exam 7: Linear Programming Applications12 Questions
Exam 8: Pricing of Joint Products and Transfer Pricing14 Questions
Exam 9: Decisions Under Risk and Uncertainty9 Questions
Select questions type
Phoenix Lumber Company uses the number of construction permits issued to help estimate demand (sales). The firm collected the following data on annual sales and number of construction permits issued in its market area: 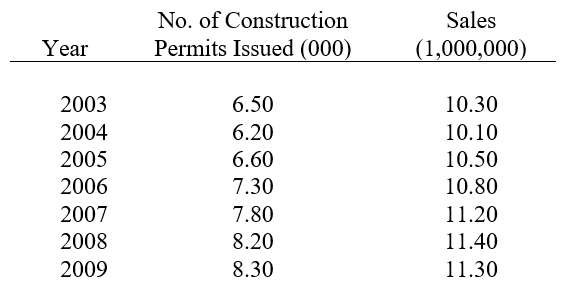 (a)Which variable is the dependent variable and which is the independent variable?
(b)Determine the estimated regression line.
(c)Test the hypothesis (at the .05 significance level) that there is no relationship between the variables.
(d)Calculate the coefficient of determination. Give an economic interpretation to the value obtained.
(e)Perform an analysis of variance on the regression including an F-test (at the .05 significance level) of the overall significance of the results.
(f)Suppose that 8,000 construction permits are expected to be issued in 2010. What would be the point estimate of Phoenix Lumber Company's sales for 2010?
(a)Which variable is the dependent variable and which is the independent variable?
(b)Determine the estimated regression line.
(c)Test the hypothesis (at the .05 significance level) that there is no relationship between the variables.
(d)Calculate the coefficient of determination. Give an economic interpretation to the value obtained.
(e)Perform an analysis of variance on the regression including an F-test (at the .05 significance level) of the overall significance of the results.
(f)Suppose that 8,000 construction permits are expected to be issued in 2010. What would be the point estimate of Phoenix Lumber Company's sales for 2010?
Free
(Essay)
4.8/5  (43)
(43)
Correct Answer: Verified
(a)Dependent variable (Y) -Sales
Independent variable (X) -No. of construction permits issued
(b) 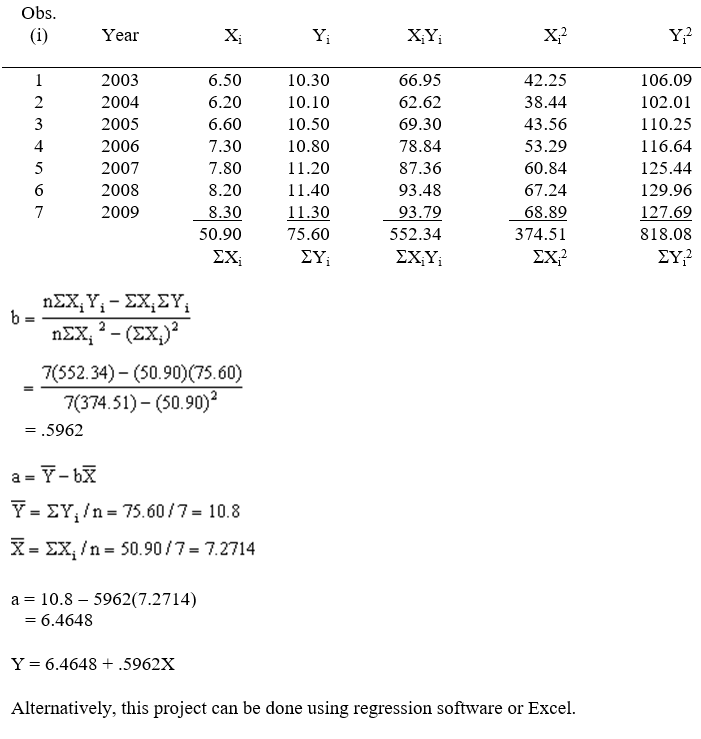 (c)
(c) 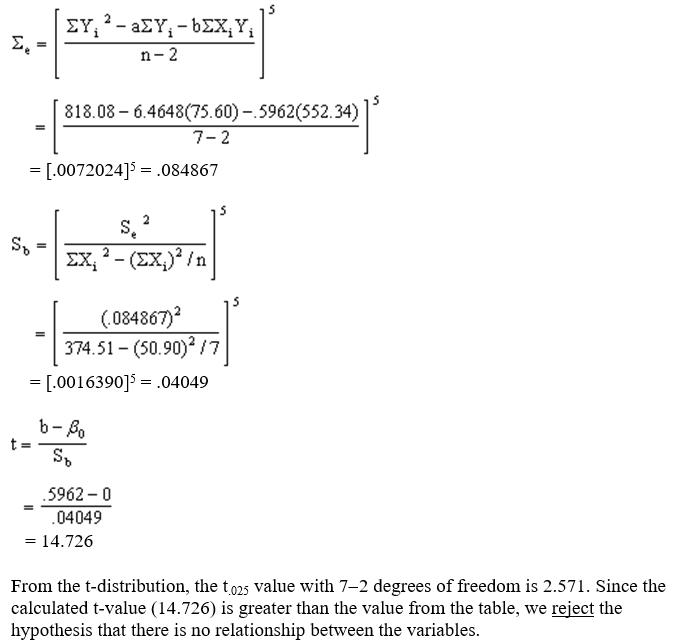 (d)
(d) 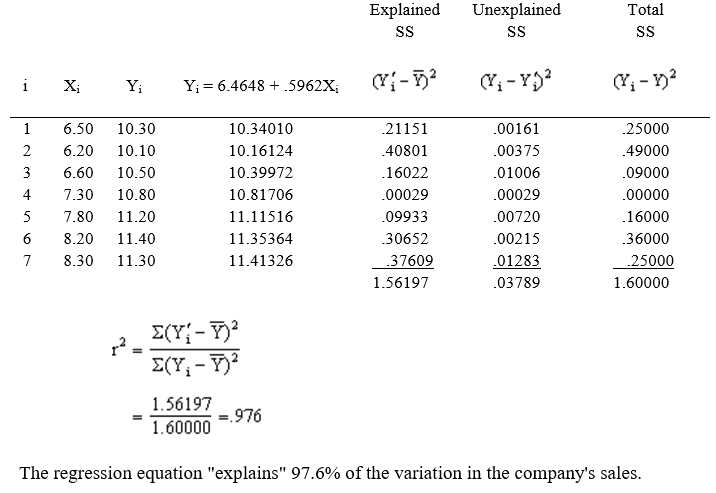 (e)
(e) 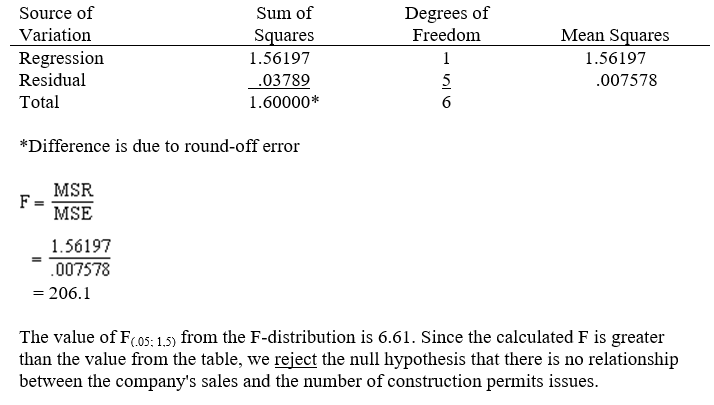 (f)X = 8,000
Y = 6.4648 + .5962(8.00) = 11.234 Estimated sales for Phoenix Lumber Company in 2010 would be $11.234 million.
In this problem, demonstrate your knowledge of percentage rates of change of an entire demand function (HINT: % Q = EP . % P + EY . % Y). You have found that the price elasticity of motor control devices at Allen-Bradley Corporation is -2, and that the income elasticity is a +1.5. You have been asked to predict sales of these devices for one year into the future. Economists from the Conference Board predict that income will be rising 3% over the next year, and AB's management is planning to raise prices 2%. You expect that the number of AB motor control devices sold in one year will:
Free
(Multiple Choice)
4.8/5 (34)
Correct Answer:Verified
E
The manager of the Sell-Rite drug store accidentally mismarked a shipment of 20-pound bags of charcoal at $4.38 instead of the regular price of $5.18. At the end of a week, the store's inventory of 200 bags of charcoal was completely sold out. The store normally sells an average of 150 bags per week.
(a)What is the store's arc elasticity of demand for charcoal?
(b)Give an economic interpretation of the numerical value obtained in part (a)
Free
(Essay)
4.9/5 (35)
Correct Answer:Verified
(a) 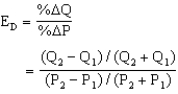 Q1 = 150 , P1 = $5.18 , Q2 = 200 , P2 = $4.38
 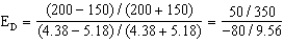 = -1.71
(b)A 1 percent increase in price will result in a 1.71 percent decrease in demand for charcoal.
Consider the following multiplicative demand function where QD = quantity demanded, P = selling price, and Y = disposable income:QD = 1.6P - 1.5Y2 The coefficient of Y (i.e., .2) indicates that (all other things being held constant):
(Multiple Choice)
4.9/5 (47)
Given the following demand function:Q = 2.0 P - 1.33 Y2.0 A.50where
Q = quantity demanded (thousands of units)
P = price ($/unit)
Y = disposable income per capita ($ thousands)
A = advertising expenditures ($ thousands)
determine the following when P = $2/unit, Y = $8 (i.e., $8000), and A = $25 (i.e., $25,000)
(a)Price elasticity of demand
(b)The approximate percentage increase in demand if disposable income percentage increases by 3%.
(c)The approximate percentage increase in demand if advertising expenditures are increased by 5 percent.
(Essay)
4.8/5 (42)
The following demand function has been estimated for Fantasy pinball machines: QD = 3,500 - 40P + 17.5Px + 670U + .0090A + 6,500N where
P = monthly rental price of Fantasy pinball machines
Px = monthly rental price of Old Chicago pinball machines (their largest competitor)
U = current unemployment rate in the 10 largest metropolitan areas
A = advertising expenditures for Fantasy pinball machines
N = fraction of the U.S. population between ages 10 and 30
(a)What is the point price elasticity of demand for Fantasy pinball machines when P = $150, Px = $100, U = .12, A = $200,000 and N = .35?
(b)What is the point cross elasticity of demand with respect to Old Chicago pinball machines for the values of the independent variables given in part (a)?
(Essay)
4.8/5 (34)
The Future Flight Corporation manufactures a variety of Frisbees selling for $2.98 each. Sales have averaged 10,000 units per month during the last year. Recently Future Flight's closest competitor, Soaring Free Company, cut its prices on similar Frisbees from $3.49 to $2.59. Future Flight noticed that its sales declined to 8,000 units per month after the price cut.
(a)What is the arc cross elasticity of demand between Future Flight's and Soaring Free's Frisbees?
(b)If Future Flight knows the arc price elasticity of demand for its Frisbees is -2.2, what price would they have to charge in order to obtain the same level of sales as before Soaring Free's price cut?
(Essay)
4.8/5 (33)
Lenny's, a national restaurant chain, conducted a study of the factors affecting demand (sales). The following variables were defined and measured for a random sample of 30 of its restaurants:
Y= Annual restaurant sales ($000)
X1= Disposable personal income (per capita) of residents within 5 mile radius
X2= License to sell beer/wine (0 = No, 1 = Yes)
X3= Location (within one-half mile of interstate highway-0 = No, 1 = Yes)
X4= Population (within 5 mile radius)
X5= Number of competing restaurants within 2 mile radius
The data were entered into a computerized regression program and the following results were obtained: 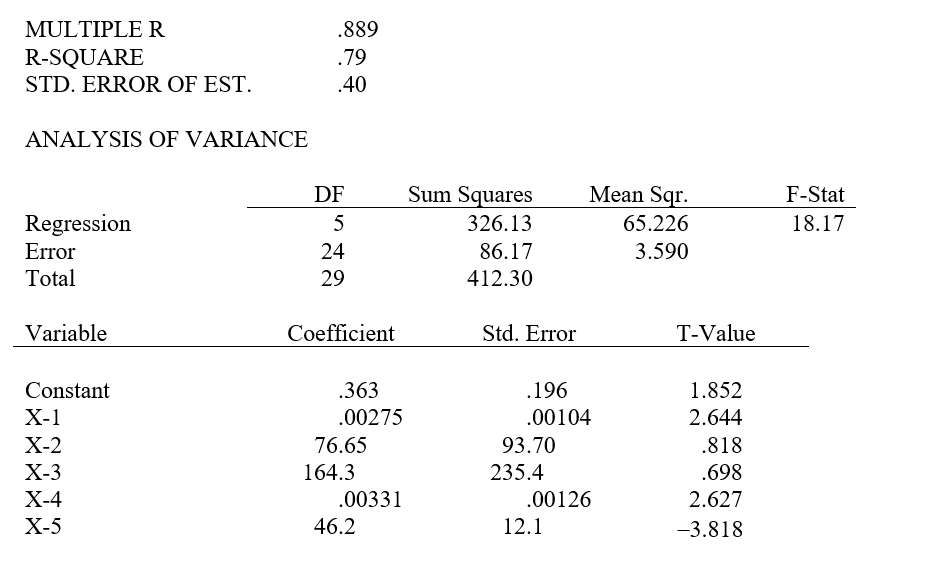 Questions:
(a)Give the regression equation for predicting restaurant sales.
(b)Give an interpretation of each of the estimated regression coefficients.
(c)Which of the independent variables (if any) are statistically significant at the .05 level in "explaining"restaurant sales?
(d)What proportion of the variation in restaurant sales is "explained"by the regression equation?
(e)Perform an F-test (at the .05 significance level) of the overall explanatory power of the regression model.
Questions:
(a)Give the regression equation for predicting restaurant sales.
(b)Give an interpretation of each of the estimated regression coefficients.
(c)Which of the independent variables (if any) are statistically significant at the .05 level in "explaining"restaurant sales?
(d)What proportion of the variation in restaurant sales is "explained"by the regression equation?
(e)Perform an F-test (at the .05 significance level) of the overall explanatory power of the regression model.
(Essay)
4.9/5 (44)
Filters
- Essay(0)
- Multiple Choice(0)
- Short Answer(0)
- True False(0)
- Matching(0)