Exam 2: From Demand to Welfare, Constraints, Choices, and Demand
Exam 1: Supply, Demand, Balancing Benefits, Costs, Principles and Preferences11 Questions
Exam 2: From Demand to Welfare, Constraints, Choices, and Demand14 Questions
Exam 3: Technology and Production13 Questions
Exam 4: Cost13 Questions
Exam 5: Choices Involving Time and Profit Maximization12 Questions
Exam 6: Behavioral Economics, Choices Involving Strateg and Choices Involving Risk17 Questions
Exam 7: Equilibrium and Efficiency21 Questions
Exam 8: Market Intervention17 Questions
Exam 9: General Equilibrium, Efficiency, and Equity14 Questions
Exam 10: Monopoly30 Questions
Exam 11: Pricing Policies39 Questions
Exam 12: Oligopoly31 Questions
Exam 13: Externalities and Public Goods17 Questions
Select questions type
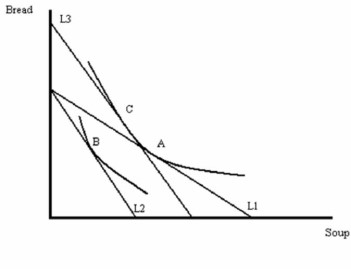 -Refer to Figure above. The income effect is shown by the movement
Free
(Multiple Choice)
4.8/5  (42)
(42)
Correct Answer: Verified
D
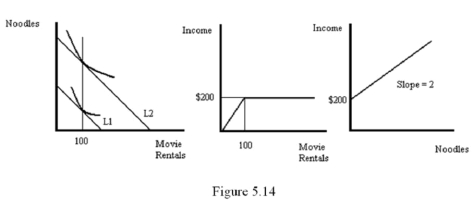
Stewie spends all of his income on movie rentals (R) and noodles (N). His marginal rate of substitution for rentals with noodles is given by MRSRN = 20/√ R. Suppose that movies rent for $2 and noodles cost $1. Plot his income-consumption curve, his Engle curve for movie rentals and his Engel curve for noodles.
Free
(Essay)
4.9/5 (35)
Correct Answer:Verified
Start with the utility maximizing condition 20/√R = PR/PN = $2/$1. Solving for R yields R = 100, implying Stewie spends $200 on movie rentals. That means he spends $2(M-200) on noodles. So, for income levels less than $200, Stewie only rents movies. His incomeconsumption curve, his Engle curve for movie rentals and his Engel curve for noodles are shown in Figure 5.14.
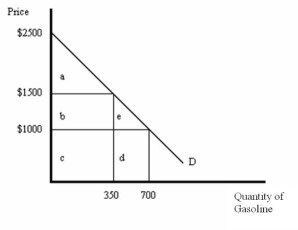 -Refer to Figure above. If the price is $1,500, then consumer surplus is equal to
Free
(Multiple Choice)
4.8/5 (35)
Correct Answer:Verified
A
For low wages, the leisure demand curve slopes ______; for higher wages it slopes ______.
(Multiple Choice)
4.7/5 (39)
Suppose a consumer's nominal income is $50,000 and the cost-of-living index is 1.3. The consumer's real income is
(Multiple Choice)
4.8/5 (38)
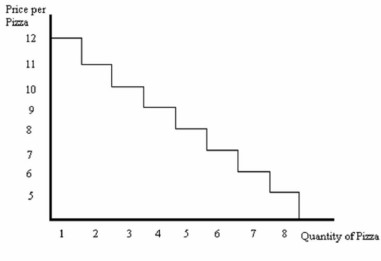 -Refer to Figure above. Suppose the price of pizza is $8.50. Then the consumer will purchase _____ pizzas and the net benefit is ______.
(Multiple Choice)
4.8/5 (32)
-Refer to Figure above. Suppose the price of pizza is $9.75. Then consumer surplus is ______.
(Multiple Choice)
4.8/5 (41)
Which of the following does NOT describe a compensating variation?
(Multiple Choice)
4.8/5 (30)
Which of the following does NOT occur when the price of a good increases?
(Multiple Choice)
4.9/5 (31)
-Refer to Figure above. The substitution effect is shown by the movement
(Multiple Choice)
4.7/5 (43)
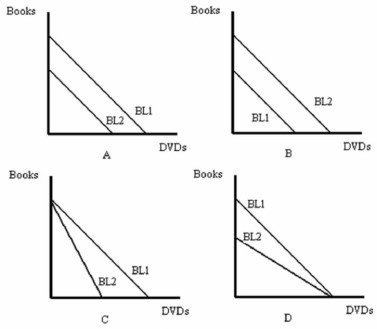 -Refer to Figure above. Which graph represents an increase in the consumer's income?
(Multiple Choice)
4.8/5 (41)
Filters
- Essay(0)
- Multiple Choice(0)
- Short Answer(0)
- True False(0)
- Matching(0)