Exam 16: Statistical Analyses
Jeff thinks that market sales are influenced by the preceding year's unemployment rate.Jeff should use a ____ for his analysis.
D
Which of the following regression equations represents the strongest relationship between X and Y?
E
Illustrate the logic of path analysis by constructing and interpreting a path diagram that traces the relationships among three or more variables.
Path analysis is a statistical method used to examine the direct and indirect relationships among multiple variables. It allows researchers to understand the complex interplay between variables and how they influence each other. To illustrate the logic of path analysis, let's construct and interpret a path diagram with three variables: X, Y, and Z.
In our hypothetical example, let's say that X represents the amount of time spent studying, Y represents academic performance, and Z represents stress levels. We want to understand how studying time and stress levels directly and indirectly influence academic performance.
First, we draw arrows (paths) to represent the hypothesized relationships between the variables. We hypothesize that studying time (X) directly influences academic performance (Y), so we draw an arrow from X to Y. We also hypothesize that studying time (X) indirectly influences academic performance (Y) through its impact on stress levels (Z), so we draw an arrow from X to Z and from Z to Y. Additionally, we hypothesize that stress levels (Z) directly influence academic performance (Y), so we draw an arrow from Z to Y.
Next, we assign coefficients to the paths to represent the strength and direction of the relationships. These coefficients are estimated using statistical techniques. For example, the coefficient for the path from X to Y represents the direct effect of studying time on academic performance, while the coefficient for the path from X to Z represents the indirect effect of studying time on academic performance through stress levels.
Interpreting the path diagram, we can see the direct and indirect pathways through which studying time and stress levels influence academic performance. By analyzing the coefficients, we can quantify the strength of these relationships and determine which pathways have the most significant impact.
In summary, path analysis allows researchers to visually represent and analyze the complex relationships among multiple variables. By constructing and interpreting a path diagram, we can gain insights into the direct and indirect effects of variables on each other, providing a deeper understanding of the underlying mechanisms at play.
Helene has two ratio-level variables in her study and wants to calculate a measure of association.Which one of the following would be best?
Which of the following statistics can be used to determine whether or not there is a statistically significant relationship between two variables in a contingency table?
In the case of r,errors are measured in terms of the sum of the squared differences between the actual value and the mean.This sum is called the
In a 2x3 table how many cells do we need to fill in before the remainder of the table is determined by the marginal frequencies?
One of the fastest growing methods of statistical analysis is the use of Geographic Information Systems (GIS)
Given the following table relating the social class of husband with the social class of wife,which of the following computations would equal the number of pairs with the same ranking?
SOCIAL CLASS OF HUSBAND

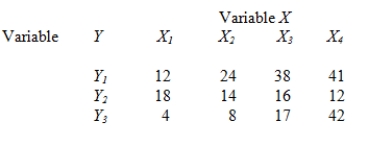
Given the following bivariate matrix,which of the following statements is(are)INCORRECT?
Which of the following is NOT an assumption underlying regression analysis?
You believe that the number of hours people spend in the labor force is a function of age.In fact,you argue that between the ages of 14 and 21 labor force participation,measured in hours,steadily increases.Between the ages of 22 and 60 it remains fairly constant.From ages 61 on it steadily declines.To analyze data,you should use
With the equation of Y = 22.7 - 0.9X,what is the predicted value of Y if X is 3?
You are interested in studying the causes of juvenile delinquency.Construct a path diagram,using theoretical constructs to indicate causal relationships with three or more independent variables.Interpret your diagram.
Roland wanted to examine the factors that lead to sex offender recidivism.He wanted to specifically determine what role previous offense history,severity of offense,and history of abuse played as independent variables.The method he should use to perform this analysis would be:
Kaylee is interested in studying the relationship between gender (male,female)and religious affiliation (Catholic,Protestant,atheist,Muslim,Hindu,etc).What measure of association should she use?
Using the following regression equation,which of the following statements is FALSE?
Y = bₒ + bX₁ + bX₂ + bX₃
Filters
- Essay(0)
- Multiple Choice(0)
- Short Answer(0)
- True False(0)
- Matching(0)