Exam 3: Randomness in Data
Exam 1: Collecting Data and Drawing Conclusions60 Questions
Exam 2: Summarizing Data55 Questions
Exam 3: Randomness in Data61 Questions
Exam 4: Inference From Data: Principles57 Questions
Exam 5: Inference From Data: Comparisons22 Questions
Exam 6: Inferences With Categorical Data32 Questions
Exam 7: Relationships in Data35 Questions
Exam 8: Analyzing Probabilities and Expected Values34 Questions
Select questions type
Suppose that a tire manufacturer believes that the lifetimes of its tires follow a normal distribution with mean 48,000 miles and standard deviation 5,000 miles.
-If the manufacturer wants to issue a guarantee so that of its tires last for longer than the guaranteed lifetime, what -score should it use to determine that guaranteed lifetime?
(Short Answer)
4.8/5  (39)
(39)
Suppose that a phone company reports that the average duration of a cell phone call is 1.7 minutes, with a standard deviation of 1.4 minutes.
-Describe how the sketch would change if the sample size were 160 calls rather than 60 calls.
(Essay)
4.8/5 (43)
Suppose that a tire manufacturer believes that the lifetimes of its tires follow a normal distribution with mean 48,000 miles and standard deviation 5,000 miles.
-If the manufacturer wants to issue a guarantee so that of its tires last for longer than the guaranteed lifetime, how many miles should it advertise as its guaranteed lifetime?
(Short Answer)
4.8/5 (46)
Suppose the number of French fries in a small bag at a particular fast-food restaurant follows a normal model with mean 49 fries and standard deviation 5 fries.
-Use this model to estimate the proportion of the bags that contain 50 or fewer fries.
(Short Answer)
4.7/5 (38)
Reconsider the activities involving the sampling of Reese's Pieces candies. Continue to suppose that of all Reese's Pieces are orange.
-Is . 45 a parameter or a statistic? What symbol would you use to represent it?
(Short Answer)
4.9/5 (39)
Reconsider the activities involving the sampling of Reese's Pieces candies. Continue to suppose that of all Reese's Pieces are orange.
-Are you more likely to get more than orange candies if you take a random sample of 40 candies or a random sample of 400 candies? Explain briefly.
Now suppose that 20 people each take a random sample of 40 candies, calculate the sample proportion of orange candies, and create a dotplot of their results.
(Essay)
4.9/5 (42)
Suppose of the incoming email messages for a college's computer system are spam.
-Would your answer to "Because you are considering a large sample size, the Central Limit Theorem predicts the sampling distribution of sample proportions of messages that are spam is approximately normal, centered at 80 with standard deviation or .0283 . So the -score for a proportion of .75 equals or -1.77 . The probability lying to the right (exceeding .75) equals .9616." be larger, smaller, or the same if the (population) proportion of spam messages were .77 rather than . 80 ? Explain briefly.
(Essay)
4.9/5 (37)
Suppose of the incoming email messages for a college's computer system are spam.
-Would your answer "Because you are considering a large sample size, the Central Limit Theorem predicts the sampling distribution of sample proportions of messages that are spam is approximately normal, centered at 80 with standard deviation or .0283 . So the -score for a proportion of .75 equals or -1.77 . The probability lying to the right (exceeding .75) equals .9616." be larger, smaller, or the same if the sample size were 100 messages rather than 200 messages? Explain briefly.
(Essay)
4.9/5 (31)
Which vary more: averages based on a few observations or averages based on many observations?
(Essay)
4.9/5 (37)
According to the "quick facts" listed on Cal Poly's website in fall 2011, the proportion of Cal Poly undergraduates who are in the College of Business is. Suppose that you select a simple random sample of 150 Cal Poly undergraduates, and let represent the sample proportion who are in the College of Business.
-Provide a well-labeled sketch to illustrate this sampling distribution.
(Short Answer)
4.8/5 (45)
Reconsider the activities involving the sampling of Reese's Pieces candies. Continue to suppose that of all Reese's Pieces are orange.
-Identify the observational units and variable of this dotplot.
(Short Answer)
4.9/5 (43)
Suppose the number of French fries in a small bag at a particular fast-food restaurant follows a normal model with mean 49 fries and standard deviation 5 fries.
-If the restaurant wants to increase the probability in "the proportion of the bags that contain at least 40 fries" by changing the standard deviation, should it increase or decrease the standard deviation? Explain intuitively, including a sketch but no calculations.
(Short Answer)
4.8/5 (29)
Give a mathematical explanation for "Averages based on many observations vary less than averages based on a few observations." based on the Central Limit Theorem. In other words, what aspect of the CLT justifies "Averages based on many observations vary less than averages based on a few observations.", and how does that aspect justify it?
(Short Answer)
4.9/5 (41)
Give brief (one-sentence) explanations for your answers to the following.
-Suppose that you repeat a random process with two possible outcomes (such as flipping a coin and observing whether it lands heads or tails, or tossing a thumbtack and seeing whether it lands up or down, or playing a game of solitaire and seeing whether you win or lose) a large number of times. Is it always legitimate to say that the proportion of times that any one particular outcome occurs will be very close to one-half? Explain.
(Essay)
4.7/5 (46)
Suppose that you have a probability of winning a game of solitaire, which remains the same in every game regardless of what happens in prior games. You decide to play games repeatedly until you win twice. You want to know the probability that you will need to play 10 games or fewer in order to achieve your goal of winning twice.
a. Describe how you could use a fair, six-sided die to simulate this process.
Now consider the following histogram that results from simulating this process 500 times: 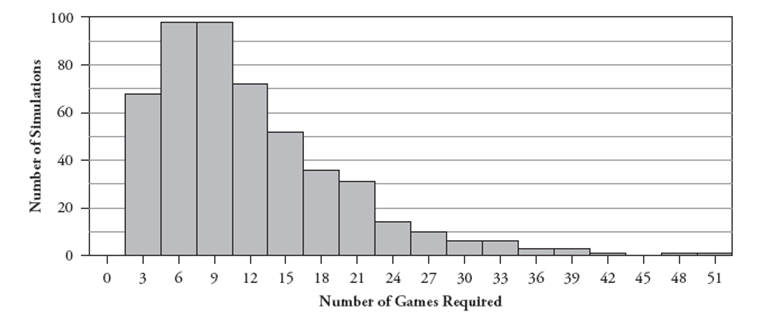 b. Use these simulation results to approximate the probability that you will finish in ten or fewer games.
(Short Answer)
4.8/5 (35)
Suppose of all heart transplant patients do not survive the operation.
a. Think about taking repeated random samples of 371 patients from this population.
Describe how the sample proportion who die would vary from sample to sample. (Hint: Be sure to refer to the shape, center, and spread of its sampling distribution.) Also include a well-labeled sketch to represent this distribution.
b. Suppose you take a random sample of 371 heart transplant patients. Determine the probability that the sample proportion who die would be .213 or higher.
(Short Answer)
4.8/5 (45)
Suppose the number of French fries in a small bag at a particular fast-food restaurant follows a normal model with mean 49 fries and standard deviation 5 fries.
-If the restaurant wants to increase the probability in "the proportion of the bags that contain at least 40 fries" by changing the mean, should it increase or decrease the mean? Explain intuitively, including a sketch but no calculations.
(Short Answer)
4.9/5 (36)
Suppose that a family has five children, consisting of three girls and two boys. Call the girls Abigail, Brianna, and Courtney; call the boys Duane and Evan. Suppose further that two of these children are to be selected at random.
-Determine the probability that one child of each gender will be selected.
(Short Answer)
4.8/5 (37)
The distribution of house prices is skewed to the right because most houses cost a modest amount but a few cost a very large amount. If you take a random sample of 1000 houses, can you reasonably expect the distribution of the house prices to be approximately normal? Explain your answer.
(Short Answer)
4.8/5 (35)
Give brief (one-sentence) explanations for your answers to the following.
-If you flip a fair coin five times and happen to get all heads, are you more likely to get a tail on the next flip?
(Short Answer)
4.9/5 (42)
Filters
- Essay(0)
- Multiple Choice(0)
- Short Answer(0)
- True False(0)
- Matching(0)