Exam 15: Aggregate Demand and Aggregate Supply Analysis
Exam 1: Economics: Foundations and Models444 Questions
Exam 2: Trade-Offs, comparative Advantage, and the Market System498 Questions
Exam 3: Where Prices Come From: the Interaction of Demand and Supply475 Questions
Exam 4: Market Efficiency and Market Failure465 Questions
Exam 5: The Economics of Health Care334 Questions
Exam 6: Firms, the Stock Market, and Corporate Governance250 Questions
Exam 7: Consumer Choice and Elasticity380 Questions
Exam 8: Technology, production, and Costs276 Questions
Exam 9: Firms in Perfectly Competitive Markets297 Questions
Exam 10: Monopoly and Antitrust Policy271 Questions
Exam 11: Monopolistic Competition and Oligopoly414 Questions
Exam 12: Gdp: Measuring Total Production and Income266 Questions
Exam 13: Unemployment and Inflation292 Questions
Exam 14: Economic Growth, the Financial System, and Business Cycles257 Questions
Exam 15: Aggregate Demand and Aggregate Supply Analysis284 Questions
Exam 16: Money, banks, and the Federal Reserve System279 Questions
Exam 17: Monetary Policy277 Questions
Exam 18: Fiscal Policy282 Questions
Exam 19: Comparative Advantage, international Trade, and Exchange Rates446 Questions
Select questions type
________ of unemployment during ________ make it easier for workers to ________ wages.
(Multiple Choice)
4.8/5  (37)
(37)
When the aggregate demand curve and the short-run aggregate supply curve intersect
(Multiple Choice)
4.8/5 (31)
Figure 15-1
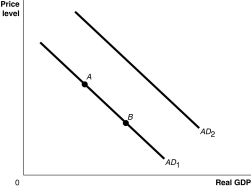 -Refer to Figure 15-1.Ceteris paribus,a decrease in firms' expectations of the future profitability of investment spending would be represented by a movement from
(Multiple Choice)
4.8/5 (41)
If workers leave a country to seek out better opportunities in another country,then this will
(Multiple Choice)
4.9/5 (36)
What is a supply shock,and why might a supply shock lead to stagflation?
(Essay)
4.9/5 (46)
During the recession of 2007-2009 in the United States,________ relative to potential GDP.
(Multiple Choice)
4.8/5 (32)
Beginning with long-run equilibrium,use the aggregate demand and aggregate supply model to illustrate what happens in the short run when the economy suffers a negative supply shock.
(Essay)
4.8/5 (37)
Use the dynamic model of aggregate demand and supply to illustrate a situation where the economy is growing but experiencing inflation in the long run.
(Essay)
4.8/5 (40)
Explain the three reasons the aggregate demand curve slopes downward.
(Essay)
4.9/5 (32)
A decrease in disposable income will shift the aggregate demand curve to the left.
(True/False)
4.8/5 (43)
Figure 15-1
-Refer to Figure 15-1.Ceteris paribus,an increase in households' expectations of their future income would be represented by a movement from
(Multiple Choice)
4.9/5 (41)
Article Summary
According to the International Energy Agency (IEA), increased oil production resulting from U.S. shale oil has invigorated the North American oil industry and has created a global supply shock. The shale oil and gas industry has generated tens of billions of dollars in revenues and hundreds of thousands of new jobs, and could result in the United States changing from being the world's largest oil importer to a net exporter within a few years. An IEA forecast predicts that because of shale oil, the United States will become the world's largest oil producer by 2017, with supply growing by 3.9 million barrels per day from 2012-2018.
-Refer to the Article Summary.The supply shock mentioned in the article summary may well result in a decrease in the price of oil.When the price of oil falls unexpectedly,the equilibrium price level ________ and the unemployment rate ________ in the short run.
(Multiple Choice)
4.8/5 (36)
Ceteris paribus,in the long run,a negative supply shock causes
(Multiple Choice)
4.8/5 (42)
A supply shock causes the long-run aggregate supply curve to shift left,decreasing the price level.
(True/False)
4.8/5 (36)
Figure 15-1
-Refer to Figure 15-1.Ceteris paribus,an increase in personal income taxes would be represented by a movement from
(Multiple Choice)
4.9/5 (31)
Figure 15-2
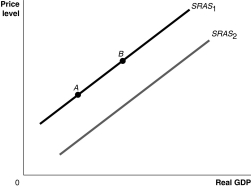 -Refer to Figure 15-2.Ceteris paribus,an increase in the price level would be represented by a movement from
(Multiple Choice)
4.7/5 (35)
Figure 15-2
-Refer to Figure 15-2.Ceteris paribus,an increase in the capital stock would be represented by a movement from
(Multiple Choice)
4.9/5 (34)
Filters
- Essay(0)
- Multiple Choice(0)
- Short Answer(0)
- True False(0)
- Matching(0)