Exam 9: Possibilities, Preferences, and Choices
Exam 1: What Is Economics212 Questions
Exam 2: The Economic Problem159 Questions
Exam 3: Demand and Supply197 Questions
Exam 4: Elasticity186 Questions
Exam 5: Efficiency and Equity119 Questions
Exam 6: Governments Actions in Markets130 Questions
Exam 7: Global Markets in Action138 Questions
Exam 8: Utility and Demand120 Questions
Exam 9: Possibilities, Preferences, and Choices124 Questions
Exam 10: Organizing Production111 Questions
Exam 11: Output and Costs142 Questions
Exam 12: Perfect Competition117 Questions
Exam 13: Monopoly118 Questions
Exam 14: Monopolistic Competition122 Questions
Exam 15: Oligopoly106 Questions
Exam 16: Externalities116 Questions
Exam 17: Public Goods and Common Resources98 Questions
Exam 18: Markets for Factors of Production128 Questions
Exam 19: Economic Inequality124 Questions
Exam 20: Measuring Gdp and Economic Growth133 Questions
Exam 21: Monitoring Jobs and Inflation121 Questions
Exam 22: Economic Growth98 Questions
Exam 23: Finance, Saving, and Investment141 Questions
Exam 24: Money, the Price Level, and Inflation126 Questions
Exam 25: The Exchange Rate and the Balance of Payments126 Questions
Exam 26: Aggregate Supply and Aggregate Demand136 Questions
Exam 27: Expenditure Multipliers171 Questions
Exam 28: The Business Cycle, Inflation, and Deflation110 Questions
Exam 29: Fiscal Policy97 Questions
Exam 30: Monetary Policy97 Questions
Exam 31: Macro Only: International Trade Policy126 Questions
Select questions type
A consumer's best affordable point occurs
Free
(Multiple Choice)
4.8/5  (26)
(26)
Correct Answer: Verified
C
Junkfood Jill spends all of her income on jellybeans and Jolt cola. Suppose that Jill's income is $30, the price of a bag of jellybeans is $6, and the price of a bottle of Jolt cola is $2. Which of the following combinations of jellybeans and Jolt cola lies inside Jill's budget line?
Free
(Multiple Choice)
4.8/5 (35)
Correct Answer:Verified
A
Use the figure below to answer the following questions.
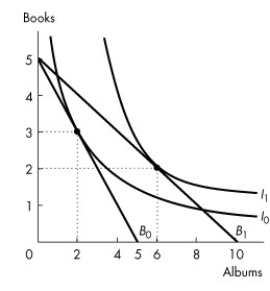 Figure 9.2.3
-Refer to Figure 9.2.3. Rashid buys only books and albums. The figure shows his preferences. When Rashid chooses the consumption point of 3 books and 2 albums, his marginal rate of substitution is
Figure 9.2.3
-Refer to Figure 9.2.3. Rashid buys only books and albums. The figure shows his preferences. When Rashid chooses the consumption point of 3 books and 2 albums, his marginal rate of substitution is
Free
(Multiple Choice)
4.9/5 (30)
Correct Answer:Verified
A
Use the figure below to answer the following question.
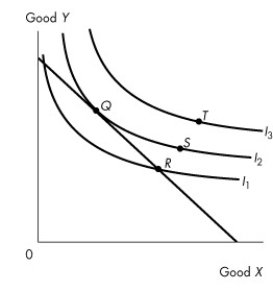 Figure 9.3.2
-Which one of the following statements about Figure 9.3.2 is true?
Figure 9.3.2
-Which one of the following statements about Figure 9.3.2 is true?
(Multiple Choice)
4.8/5 (43)
Which of the following results in a rightward shift of your indifference curves for gasoline and movie rentals?
(Multiple Choice)
4.8/5 (34)
Use the figure below to answer the following question.
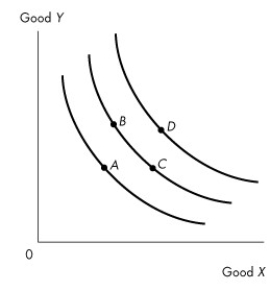 Figure 9.2.2
-Figure 9.2.2 shows three indifference curves for Brenda. Which one of the following is not true?
Figure 9.2.2
-Figure 9.2.2 shows three indifference curves for Brenda. Which one of the following is not true?
(Multiple Choice)
4.8/5 (33)
Use the figure below to answer the following questions.
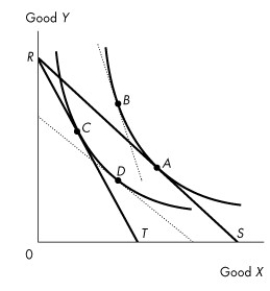 Figure 9.3.3
-Consider an initial budget line labelled RS in Figure 9.3.3. If the budget line becomes RT, the substitution effect is illustrated by the move from point
Figure 9.3.3
-Consider an initial budget line labelled RS in Figure 9.3.3. If the budget line becomes RT, the substitution effect is illustrated by the move from point
(Multiple Choice)
4.9/5 (37)
Use the figure below to answer the following questions.
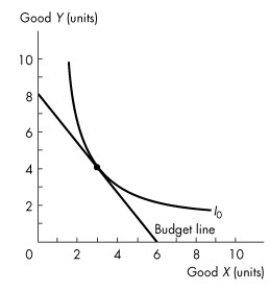 Figure 9.3.1
-Consider the budget line and indifference curve in Figure 9.3.1. If the price of good X is $2 a unit, what is the price of good Y?
Figure 9.3.1
-Consider the budget line and indifference curve in Figure 9.3.1. If the price of good X is $2 a unit, what is the price of good Y?
(Multiple Choice)
4.9/5 (40)
A change in the price of the good measured on the horizontal axis changes ________ of the budget line.
(Multiple Choice)
4.7/5 (40)
If the price of the good measured on the vertical axis increases, the budget line
(Multiple Choice)
4.8/5 (36)
The shape of a person's indifference curves between two goods depends on
(Multiple Choice)
4.8/5 (41)
Peter's income increases and so does his consumption of both movies and pop, but his consumption of pop increases by less than his consumption of movies increases. Which one of the following statements is true for Peter?
(Multiple Choice)
4.8/5 (36)
Use the figure below to answer the following question.
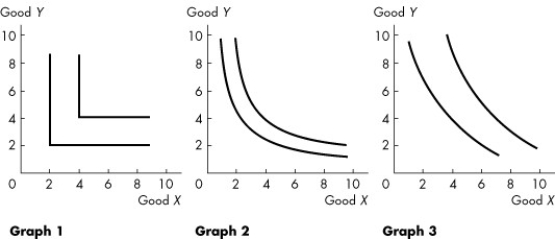 Figure 9.2.5
-Refer to Figure 9.2.5. The graphs show indifference curves for various goods. Graph ________ best describes the pair of goods baseballs and baseball bats. Graph ________ best describes the pair of goods desktop computers and laptop computers.
Figure 9.2.5
-Refer to Figure 9.2.5. The graphs show indifference curves for various goods. Graph ________ best describes the pair of goods baseballs and baseball bats. Graph ________ best describes the pair of goods desktop computers and laptop computers.
(Multiple Choice)
4.9/5 (30)
Use the figure below to answer the following question.
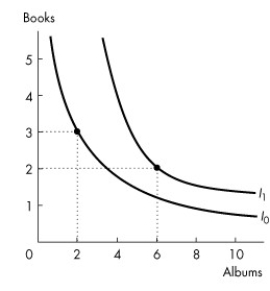 Figure 9.2.4
-Refer to Figure 9.2.4. Rashid buys only books and albums. The figure shows his preferences. Rashid's indifference curves ________ display diminishing marginal rate of substitution because ________.
Figure 9.2.4
-Refer to Figure 9.2.4. Rashid buys only books and albums. The figure shows his preferences. Rashid's indifference curves ________ display diminishing marginal rate of substitution because ________.
(Multiple Choice)
4.8/5 (24)
Use the figure below to answer the following questions.
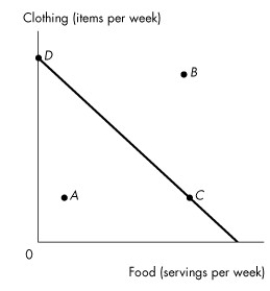 Figure 9.1.1
-Shelly's budget line is shown in Figure 9.1.1 Which point is unaffordable given her income and current prices?
Figure 9.1.1
-Shelly's budget line is shown in Figure 9.1.1 Which point is unaffordable given her income and current prices?
(Multiple Choice)
4.8/5 (30)
Guy has an income (Y)of $50 with which he can purchase DVDs (D)at $10 each and haircuts (H)at $20 each. Which one of the following represents Guy's budget line?
(Multiple Choice)
4.9/5 (40)
Suppose the price of potatoes falls and there is a decrease in the purchases of potatoes, what can we infer?
(Multiple Choice)
4.9/5 (38)
Filters
- Essay(0)
- Multiple Choice(0)
- Short Answer(0)
- True False(0)
- Matching(0)