Exam 3: Demand and Supply
Exam 1: What Is Economics212 Questions
Exam 2: The Economic Problem159 Questions
Exam 3: Demand and Supply198 Questions
Exam 20: Measuring Gdp and Economic Growth133 Questions
Exam 21: Monitoring Jobs and Inflation121 Questions
Exam 22: Economic Growth98 Questions
Exam 23: Finance, Saving, and Investment141 Questions
Exam 24: Money, the Price Level, and Inflation126 Questions
Exam 25: The Exchange Rate and the Balance of Payments126 Questions
Exam 26: Aggregate Supply and Aggregate Demand136 Questions
Exam 27: Expenditure Multipliers171 Questions
Exam 28: The Business Cycle, Inflation, and Deflation110 Questions
Exam 29: Fiscal Policy97 Questions
Exam 30: Monetary Policy97 Questions
Exam 31: International Trade Policy126 Questions
Select questions type
Networks increase the price they charge cable television firms for programming. As a result, the price of cable television rises. Choose the correct statement.
(Multiple Choice)
4.9/5  (32)
(32)
Figure 3.2.1
Use the figure below to answer the following questions.
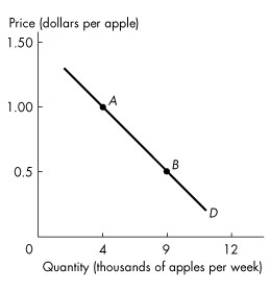 -Which one of the following statements best characterizes point B in Figure 3.2.1?
(Multiple Choice)
4.8/5 (35)
The kitchen manager at an Italian restaurant is deciding what assignments he should give to his two cooks, John and David. John can make 25 pizzas or 40 servings of pasta per hour and David can make 20 pizzas or 30 servings of pasta per hour. Which is the manager's best choice?
(Multiple Choice)
4.9/5 (44)
Table 3.5.3
Demand and supply schedules for designer sport t-shirts at CoolU
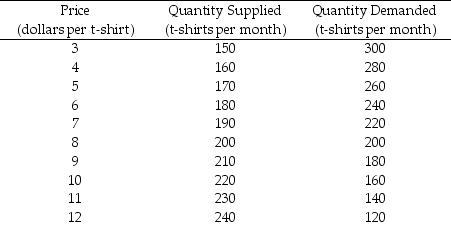 Use the table below to answer the following questions.
-Refer to Table 3.5.3. A new store opens up on the edge of campus, Great Wild North Sportswear, which has the capacity to do as much business as all the existing businesses. The quantity of t-shirts supplied doubles at each price. The new equilibrium price is $________ and the new equilibrium quantity is ________ t-shirts per month.
Use the table below to answer the following questions.
-Refer to Table 3.5.3. A new store opens up on the edge of campus, Great Wild North Sportswear, which has the capacity to do as much business as all the existing businesses. The quantity of t-shirts supplied doubles at each price. The new equilibrium price is $________ and the new equilibrium quantity is ________ t-shirts per month.
(Multiple Choice)
4.9/5 (44)
Figure 3.2.2
Use the figure below to answer the following questions.
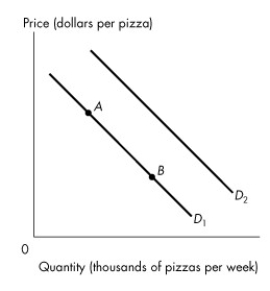 -Refer to Figure 3.2.2. If consumers' income increases,
(Multiple Choice)
4.8/5 (36)
Which one of the following correctly describes how price adjustment eliminates a shortage?
(Multiple Choice)
4.9/5 (35)
Which one of the following correctly describes how price adjustment eliminates a surplus?
(Multiple Choice)
4.8/5 (36)
The income effect influences food purchases because when the price of a certain food rises, other things remaining the same, ________. Consumers ________.
(Multiple Choice)
4.8/5 (41)
Table 3.5.2
Demand and Supply Schedules for Cups of Coffee each day at CoolU
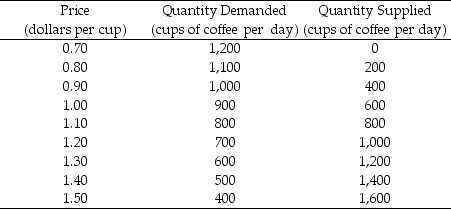 Use the figure below to answer the following questions.
-Refer to Table 3.5.2. A premature frost destroys half the coffee trees. This change would be represented as a
Use the figure below to answer the following questions.
-Refer to Table 3.5.2. A premature frost destroys half the coffee trees. This change would be represented as a
(Multiple Choice)
4.8/5 (46)
People buy more of good 1 when the price of good 2 rises. Good 1 and good 2 are
(Multiple Choice)
4.9/5 (34)
Tom and Don have different opportunity costs of producing two goods. If Tom and Don specialize in producing the goods in which each has a comparative advantage and they exchange goods, then
(Multiple Choice)
4.9/5 (33)
The y- axis intercept of the supply curve is 40 and the slope is 6. The equation of the supply curve is
(Multiple Choice)
4.8/5 (39)
All grapefruit juice producers have decided to blend tangerine juice with grapefruit juice. This blend results in a higher cost of production, but studies show that consumers prefer the taste of the blend to straight grapefruit juice. What will happen to the equilibrium price and quantity of grapefruit juice?
(Multiple Choice)
4.9/5 (36)
Figure 3.5.2
Original equilibrium at 1.
Use the figure below to answer the following questions.
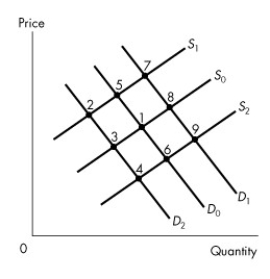 -Refer to Figure 3.5.2, which represents the market for beans. If the price of peas, a substitute for beans and a substitute in production, rises, what is the new beans equilibrium, ceteris paribus?
(Multiple Choice)
4.9/5 (40)
Figure 3.2.2
Use the figure below to answer the following questions.
-Refer to Figure 3.2.2. Which one of the following represents a decrease in quantity demanded?
(Multiple Choice)
4.7/5 (41)
Figure 3.5.2
Original equilibrium at 1.
Use the figure below to answer the following questions.
-Refer to Figure 3.5.2, which represents the market for beer. If the price of pizza, a complement of beer rises, what is the new beer equilibrium, ceteris paribus?
(Multiple Choice)
4.8/5 (41)
Figure 3.4.1
Use the figure below to answer the following questions.
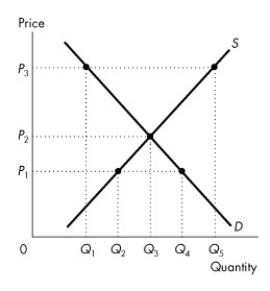 -At price P₂ in Figure 3.4.1, which one of the following is not true?
(Multiple Choice)
4.9/5 (45)
Figure 3.5.1
Use the figure below to answer the following questions.
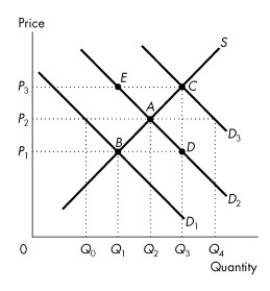 -If the demand curve is D₂ in Figure 3.5.1,
(Multiple Choice)
5.0/5 (39)
Filters
- Essay(0)
- Multiple Choice(0)
- Short Answer(0)
- True False(0)
- Matching(0)