Exam 28: The Business Cycle, Inflation, and Deflation
Exam 1: What Is Economics212 Questions
Exam 2: The Economic Problem159 Questions
Exam 3: Demand and Supply198 Questions
Exam 20: Measuring Gdp and Economic Growth133 Questions
Exam 21: Monitoring Jobs and Inflation121 Questions
Exam 22: Economic Growth98 Questions
Exam 23: Finance, Saving, and Investment141 Questions
Exam 24: Money, the Price Level, and Inflation126 Questions
Exam 25: The Exchange Rate and the Balance of Payments126 Questions
Exam 26: Aggregate Supply and Aggregate Demand136 Questions
Exam 27: Expenditure Multipliers171 Questions
Exam 28: The Business Cycle, Inflation, and Deflation110 Questions
Exam 29: Fiscal Policy97 Questions
Exam 30: Monetary Policy97 Questions
Exam 31: International Trade Policy126 Questions
Select questions type
Figure 28.2.3
Use the figure below to answer the following questions.
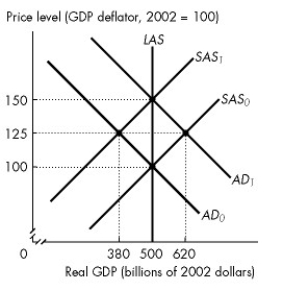 -Refer to Figure 28.2.3. Assume that the figure illustrates an economy initially in equilibrium at the intersection of the SAS₀ curve and the AD₀ curve. If the aggregate demand curve is correctly expected to shift to AD₁, new equilibrium real GDP is ________ and the new equilibrium price level is ________.
(Multiple Choice)
4.8/5  (37)
(37)
Which of the following is not a mainstream theory of the business cycle?
(Multiple Choice)
4.9/5 (38)
Fact 28.4.2
The Reserve Bank of New Zealand signed an agreement with the New Zealand government in which the Bank agreed to maintain inflation inside a low target range. Failure to achieve the target would result in the governor of the Bank losing his job.
-Consider Fact 28.4.2. Choose the correct statement.
(Multiple Choice)
4.8/5 (37)
Suppose the economy is in long-run equilibrium when the price of oil rises. Which one of the following is not a short-run effect of this situation?
(Multiple Choice)
4.9/5 (36)
Along the short-run Phillips curve, everything remaining the same, the higher the
(Multiple Choice)
4.9/5 (27)
Figure 28.2.1
Use the figure below to answer the following question.
 -Refer to Figure 28.2.1. The figure illustrates an economy initially in equilibrium at the intersection of the SAS₀ curve and the AD₀ curve. Which of the following shifts the short-run aggregate supply curve from SAS₀ to SAS₁?
(Multiple Choice)
4.8/5 (34)
Which of the following would cause the aggregate demand curve to keep shifting rightward year after year?
(Multiple Choice)
4.8/5 (44)
Suppose OPEC unexpectedly collapses, which leads to a fall in the price of oil. As a result, the price level
(Multiple Choice)
4.8/5 (39)
The short-run Phillips curve shows the relationship between
(Multiple Choice)
4.8/5 (39)
In real business cycle theory, a decrease in productivity leads to all of the following events EXCEPT
(Multiple Choice)
4.8/5 (39)
A movement down along the short-run Phillips curve results from an unanticipated
(Multiple Choice)
4.8/5 (41)
An unanticipated deflation does all of the following except
(Multiple Choice)
4.7/5 (38)
According to the real business cycle theory, during a recession the demand for labour ________ and the supply of labour ________.
(Multiple Choice)
4.7/5 (42)
An increase in the price level due to an increase in the price of oil
(Multiple Choice)
4.9/5 (34)
New Keynesian economists believe that ________ is influenced by ________.
(Multiple Choice)
4.8/5 (38)
Filters
- Essay(0)
- Multiple Choice(0)
- Short Answer(0)
- True False(0)
- Matching(0)