Exam 4: Economic Efficiency,government Price Setting,and Taxes
Exam 1: Economics: Foundations and Models145 Questions
Exam 2: Trade-Offs, comparative Advantage, and the Market System152 Questions
Exam 3: Where Prices Come From: the Interaction of Demand and Supply149 Questions
Exam 4: Economic Efficiency,government Price Setting,and Taxes137 Questions
Exam 5: The Economics of Health Care117 Questions
Exam 6: Firms, the Stock Market, and Corporate Governance140 Questions
Exam 7: Comparative Advantage and the Gains From International Trade124 Questions
Exam 8: Gdp: Measuring Total Production and Income135 Questions
Exam 9: Unemployment and Inflation148 Questions
Exam 10: Economic Growth, the Financial System, and Business Cycles130 Questions
Exam 11: Long-Run Economic Growth: Sources and Policies134 Questions
Exam 12: Aggregate Expenditure and Output in the Short Run157 Questions
Exam 13: Aggregate Demand and Aggregate Supply Analysis145 Questions
Exam 14: Money,banks,and the Federal Reserve System144 Questions
Exam 15: Monetary Policy145 Questions
Exam 16: Fiscal Policy155 Questions
Exam 17: Inflation, unemployment, and Federal Reserve Policy135 Questions
Exam 18: Macroeconomics in an Open Economy145 Questions
Exam 19: The International Financial System139 Questions
Select questions type
Figure 4-4
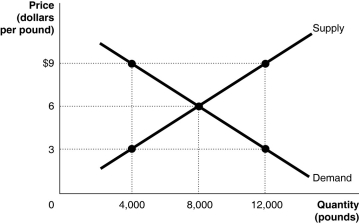 -Refer to Figure 4-4.The figure above represents the market for pecans.Assume that this is a competitive market.If 8,000 pounds of pecans are sold
Free
(Multiple Choice)
4.7/5  (37)
(37)
Correct Answer: Verified
D
Figure 4-8
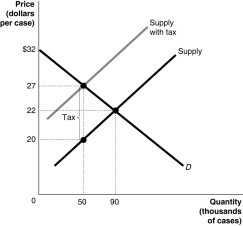 Figure 4-8 shows the market for beer. The government plans to impose a unit tax in this market.
-Refer to Figure 4-8.The price buyers pay after the tax is
Figure 4-8 shows the market for beer. The government plans to impose a unit tax in this market.
-Refer to Figure 4-8.The price buyers pay after the tax is
Free
(Multiple Choice)
4.8/5 (28)
Correct Answer:Verified
D
In the economic sense,almost everything is scarce.________ of a good or service occurs when the quantity demanded is greater than the quantity supplied at the current market price.
Free
(Multiple Choice)
4.9/5 (38)
Correct Answer:Verified
B
Figure 4-4
-Refer to Figure 4-4.The figure above represents the market for pecans.Assume that this is a competitive market.If the price of pecans is $3,what changes in the market would result in an economically efficient output?
(Multiple Choice)
4.8/5 (34)
The difference between the highest price a consumer is willing to pay for a good and the price the consumer actually pays is called
(Multiple Choice)
4.8/5 (25)
A tax that imposes a small excess burden relative to the tax revenue that it raises is
(Multiple Choice)
4.9/5 (30)
Which of the following is not a result of government price controls?
(Multiple Choice)
4.8/5 (33)
The division of the burden of a tax between buyers and sellers in a market is called tax allocation.
(True/False)
4.9/5 (33)
Refer to Figure 4-3.What is the value of producer surplus at a price of $18??
(Multiple Choice)
4.9/5 (36)
Figure 4-9
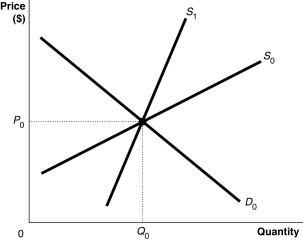 -Refer to Figure 4-9.Suppose the market is initially in equilibrium at price P0 and now the government imposes a tax on every unit sold.Which of the following statements best describes the impact of the tax? For demand curve D0
(Multiple Choice)
4.9/5 (40)
Figure 4-4
-Refer to Figure 4-4.The figure above represents the market for pecans.Assume that this is a competitive market.At a price of $9
(Multiple Choice)
4.8/5 (34)
Which term refers to a legally established minimum price that firms may charge?
(Multiple Choice)
4.8/5 (31)
Economists are reluctant to state that price controls are desirable or undesirable because
(Multiple Choice)
4.9/5 (37)
Consumer surplus in a market for a product would be equal to ________ if the market price was zero.
(Multiple Choice)
4.8/5 (32)
Figure 4-1
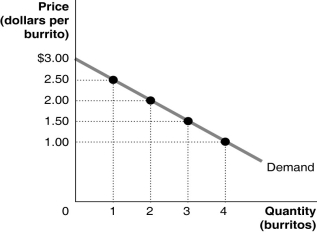 Figure 4-1 shows Arnold's demand curve for burritos.
-Refer to Figure 4-1.What is the total amount that Arnold is willing to pay for 4 burritos?
Figure 4-1 shows Arnold's demand curve for burritos.
-Refer to Figure 4-1.What is the total amount that Arnold is willing to pay for 4 burritos?
(Multiple Choice)
5.0/5 (39)
David Card and Alan Kruger conducted a study of fast-food restaurants in New Jersey and Pennsylvania.The study found that
(Multiple Choice)
4.9/5 (28)
Figure 4-8
Figure 4-8 shows the market for beer. The government plans to impose a unit tax in this market.
-Refer to Figure 4-8.How much of the tax is paid by producers?
(Multiple Choice)
4.9/5 (31)
The government proposes a tax on imported champagne.Buyers will bear the entire burden of the tax if the
(Multiple Choice)
4.8/5 (34)
Filters
- Essay(0)
- Multiple Choice(0)
- Short Answer(0)
- True False(0)
- Matching(0)