Exam 8: Statistical Functions
Exam 1: Introduction to Excel100 Questions
Exam 2: Formulas and Functions100 Questions
Exam 3: Charts100 Questions
Exam 4: Datasets and Tables100 Questions
Exam 5: Subtotals, Pivot-tables, and Pivot-charts100 Questions
Exam 6: What-If Analysis100 Questions
Exam 7: Specialized Functions100 Questions
Exam 8: Statistical Functions100 Questions
Exam 9: Multiple-Sheet Workbook Management98 Questions
Exam 10: Imports, xml, and Power Add-Ins95 Questions
Exam 11: Collaboration and Workbook Distribution96 Questions
Exam 12: Templates, styles, and Macros97 Questions
Exam 13: Office 2016 Common Features100 Questions
Select questions type
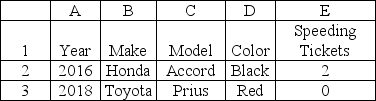
This is the top three lines in a list of 8200 records.You want an average of the number of speeding tickets for Red Toyota Priuses.Which is the correct formula?
(Multiple Choice)
4.8/5  (40)
(40)
Which function returns the rank of a value within a dataset,assigning an average rank for tied values?
(Multiple Choice)
4.9/5 (28)
The PERCENTRANK.INC function displays a value's rank as a percentile of a range,including 0% and 100%.
(True/False)
4.8/5 (39)
A(n)________ is a visual depiction of a population distribution created by the Analysis ToolPak.
(Multiple Choice)
4.9/5 (43)
The ________ function returns a value's rank as a percent between 0% and 100%.
(Short Answer)
4.9/5 (40)
Match each of the following concepts to its best description:
Correct Answer: Verified
Premises:
Responses:
(Matching)
4.8/5 (37)
Match each of the following functions to its best description of its purpose:
Correct Answer:Verified
Premises:
Responses:
(Matching)
4.8/5 (36)
A quartile is a value used to divide a range into five equal groups.
(True/False)
4.9/5 (33)
Which of the following represents the number of data points in a sample minus one?
(Multiple Choice)
4.8/5 (37)
The ________ function is best suited to calculate quartiles including quartiles 0 and 4.
(Short Answer)
4.8/5 (32)
The arguments for COUNTIFS,SUMIFS,AVERAGEIFS are Range and Criteria.
(True/False)
5.0/5 (34)
________ is the measure of how far the data sample spreads from the mean.
(Short Answer)
4.8/5 (30)
________ is a measure of a dataset's dispersion or the difference between the highest and lowest values.
(Short Answer)
4.9/5 (38)
Which of the following functions determines the standard deviation of a sample?
(Multiple Choice)
4.8/5 (34)
What would be the result of this formula:
=AVERAGEIF(A2:
A64,"Green",C2:
C64)?
(Multiple Choice)
4.9/5 (38)
What is the common name for the square root of the variance?
(Multiple Choice)
4.7/5 (38)
Which of the following values would demonstrate the strongest positive relationship while using the CORREL function?
(Multiple Choice)
4.7/5 (33)
________ is a statistical hypothesis test that helps determine if samples of data were taken from the same population.
(Short Answer)
4.8/5 (48)
Filters
- Essay(0)
- Multiple Choice(0)
- Short Answer(0)
- True False(0)
- Matching(0)