Exam 5: The Behavior of Interest Rates
Exam 1: Why Study Money,banking,and Financial Markets108 Questions
Exam 2: An Overview of the Financial System137 Questions
Exam 3: What Is Money95 Questions
Exam 4: The Meaning of Interest Rates103 Questions
Exam 5: The Behavior of Interest Rates159 Questions
Exam 6: The Risk and Term Structure of Interest Rates114 Questions
Exam 7: The Stock Market, the Theory of Rational Expectations, and the Efficient Market Hypothesis97 Questions
Exam 8: An Economic Analysis of Financial Structure93 Questions
Exam 9: Banking and the Management of Financial Institutions148 Questions
Exam 10: Economic Analysis of Financial Regulation98 Questions
Exam 11: Banking Industry: Structure and Competition137 Questions
Exam 12: Financial Crises44 Questions
Exam 13: Nonbank Finance78 Questions
Exam 14: Financial Derivatives90 Questions
Exam 15: Conflicts of Interest in the Financial Industry50 Questions
Exam 16: Central Banks and the Federal Reserve System71 Questions
Exam 17: The Money Supply Process218 Questions
Exam 18: Tools of Monetary Policy121 Questions
Exam 19: The Conduct of Monetary Policy: Strategy and Tactics116 Questions
Exam 20: The Foreign Exchange Market123 Questions
Exam 21: The International Financial System117 Questions
Exam 22: Quantity Theory, inflation and the Demand for Money112 Questions
Exam 23: Aggregate Demand and Supply Analysis108 Questions
Exam 24: Monetary Policy Theory58 Questions
Exam 25: Transmission Mechanisms of Monetary Policy62 Questions
Exam 26: Financial Crises in Emerging Market Economies21 Questions
Exam 27: The IS Curve130 Questions
Exam 28: The Monetary Policy and Aggregate Demand Curves29 Questions
Exam 29: The Role of Expectations in Monetary Policy31 Questions
Exam 30: The ISLM Model99 Questions
Select questions type
The risk of a well-diversified portfolio depends only on the ________ risk of the assets in the portfolio.
(Multiple Choice)
4.9/5  (36)
(36)
Everything else held constant,if interest rates are expected to fall in the future,the demand for long-term bonds today ________ and the demand curve shifts to the ________.
(Multiple Choice)
4.8/5 (36)
During business cycle expansions when income and wealth are rising,the demand for bonds ________ and the demand curve shifts to the ________,everything else held constant.
(Multiple Choice)
4.8/5 (43)
Interest rates increased continuously during the 1970s.The most likely explanation is
(Multiple Choice)
4.7/5 (29)
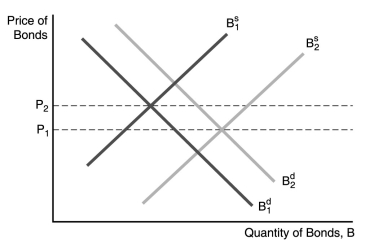 -In the figure above,the price of bonds would fall from P₂ to P₁ if
(Multiple Choice)
4.9/5 (41)
Milton Friedman called the response of lower interest rates resulting from an increase in the money supply the ________ effect.
(Multiple Choice)
4.9/5 (40)
The bond demand curve is ________ sloping,indicating a(n)________ relationship between the price and quantity demanded of bonds,everything else equal.
(Multiple Choice)
4.9/5 (36)
Everything else held constant,when real estate prices are expected to decrease
(Multiple Choice)
4.7/5 (40)
In his Liquidity Preference Framework,Keynes assumed that money has a zero rate of return;thus
(Multiple Choice)
4.9/5 (29)
If wealth increases,the demand for stocks ________ and that of long-term bonds ________,everything else held constant.
(Multiple Choice)
4.8/5 (36)
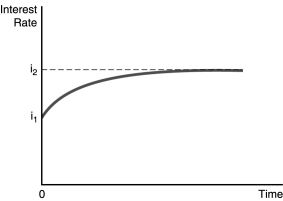 -In the figure above,illustrates the effect of an increased rate of money supply growth at time period 0.From the figure,one can conclude that the
(Multiple Choice)
4.8/5 (34)
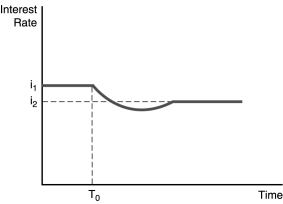 -The figure above illustrates the effect of an increased rate of money supply growth at time period T₀.From the figure,one can conclude that the
(Multiple Choice)
4.9/5 (42)
An increase in an asset's expected return relative to that of an alternative asset,holding everything else constant,________ the quantity demanded of the asset.
(Multiple Choice)
4.8/5 (35)
Using the liquidity preference framework,what will happen to interest rates if the Fed increases the money supply?
(Essay)
4.7/5 (40)
 -In the figure above,a factor that could cause the supply of bonds to shift to the right is
(Multiple Choice)
5.0/5 (25)
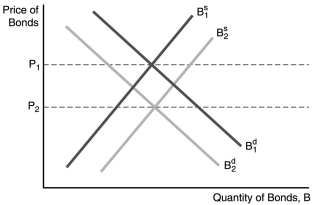
Use demand and supply analysis to explain why an expectation of Fed rate hikes would cause Treasury prices to fall.
(Essay)
4.9/5 (32)
When real income ________,the demand curve for money shifts to the ________ and the interest rate ________,everything else held constant.
(Multiple Choice)
4.9/5 (34)
When the price level falls,the ________ curve for nominal money ________,and interest rates ________,everything else held constant.
(Multiple Choice)
4.9/5 (35)
During a recession,the supply of bonds ________ and the supply curve shifts to the ________,everything else held constant.
(Multiple Choice)
4.8/5 (47)
The bond supply and demand framework is easier to use when analyzing the effects of changes in ________,while the liquidity preference framework provides a simpler analysis of the effects from changes in income,the price level,and the supply of ________.
(Multiple Choice)
4.8/5 (39)
Filters
- Essay(0)
- Multiple Choice(0)
- Short Answer(0)
- True False(0)
- Matching(0)