Exam 5: The Behaviour of Interest Rates
Exam 1: Why Study Money, Banking, and Financial Markets111 Questions
Exam 2: An Overview of the Financial System110 Questions
Exam 3: What Is Money110 Questions
Exam 4: Understanding Interest Rates110 Questions
Exam 5: The Behaviour of Interest Rates109 Questions
Exam 6: The Risk and Term Structure of Interest Rates110 Questions
Exam 7: The Stock Market, the Theory of Rational Expectations, and the Efficient Market Hypothesis110 Questions
Exam 8: An Economic Analysis of Financial Structure110 Questions
Exam 9: Financial Crises98 Questions
Exam 10: Economic Analysis of Financial Regulation101 Questions
Exam 11: Banking Industry: Structure and Competition112 Questions
Exam 12: Banking and the Management of Financial Institutions138 Questions
Exam 13: Risk Management With Financial Derivatives110 Questions
Exam 14: Central Banks and the Bank of Canada110 Questions
Exam 15: The Money Supply Process166 Questions
Exam 16: Tools of Monetary Policy109 Questions
Exam 17: The Conduct of Monetary Policy: Strategy and Tactics118 Questions
Exam 18: The Foreign Exchange Market129 Questions
Exam 19: The International Financial System140 Questions
Exam 20: Quantity Theory, Inflation, and the Demand for Money111 Questions
Exam 21: The Is Curve139 Questions
Exam 22: The Monetary Policy and Aggregate Demand Curves108 Questions
Exam 23: Aggregate Demand and Supply Analysis131 Questions
Exam 24: Monetary Policy Theory91 Questions
Exam 25: The Role of Expectations in Monetary Policy110 Questions
Exam 26: Transmission Mechanisms of Monetary Policy108 Questions
Exam 27: Financial Crises in Emerging Markets31 Questions
Exam 28: The ISLM Model107 Questions
Exam 29: Non-Bank Finance109 Questions
Select questions type
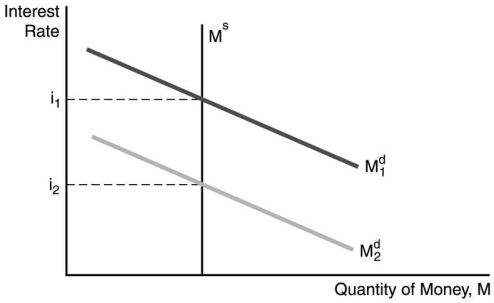 -In the figure above, the decrease in the interest rate from i₁ to i₂ can be explained by ________.
(Multiple Choice)
5.0/5  (43)
(43)
The risk of a well-diversified portfolio depends only on the ________ risk of the assets in the portfolio.
(Multiple Choice)
4.8/5 (35)
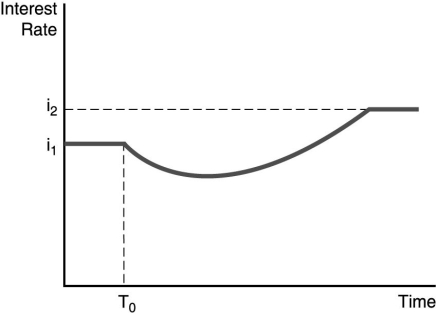 -The figure above illustrates the effect of an increased rate of money supply growth at time period T₀. From the figure, one can conclude that the ________.
(Multiple Choice)
4.8/5 (35)
In the liquidity preference framework, demonstrate graphically the effect of a decrease in the money supply. Indicate on the graph the excess demand or excess supply of money. Explain the process of adjustment that results in a change in the equilibrium interest rate, and the direction of the change in rates.
(Essay)
4.9/5 (26)
A lower level of income causes the demand for money to ________ and the interest rate to ________, everything else held constant.
(Multiple Choice)
4.9/5 (37)
When gold prices become more volatile, the ________ curve for gold shifts to the ________; ________ the price of gold.
(Multiple Choice)
4.9/5 (32)
Using the liquidity preference framework, show what happens to interest rates during a business cycle recession.
(Essay)
4.9/5 (29)
If brokerage commissions on bond sales decrease, then, other things equal, the demand for bonds will ________ and the demand for real estate will ________.
(Multiple Choice)
4.9/5 (23)
Milton Friedman called the response of lower interest rates resulting from an increase in the money supply the ________ effect.
(Multiple Choice)
4.8/5 (34)
Using the liquidity preference framework, what will happen to interest rates if the Bank of Canada increases the money supply?
(Essay)
4.8/5 (37)
A decrease in the brokerage commissions in the housing market from 6 percent to 5 percent of the sales price will shift the ________ curve for bonds to the ________, everything else held constant.
(Multiple Choice)
4.8/5 (44)
 -In the figure above, illustrates the effect of an increased rate of money supply growth at time period 0. From the figure, one can conclude that the ________.
(Multiple Choice)
4.8/5 (39)
The demand for silver decreases, other things equal, when ________.
(Multiple Choice)
4.8/5 (36)
Holding all other factors constant, the quantity demanded of an asset is ________.
(Multiple Choice)
4.8/5 (37)
In Keynes's liquidity preference framework, if there is excess demand for money, there is ________.
(Multiple Choice)
4.8/5 (45)
Everything else held constant, an increase in the riskiness of bonds relative to alternative assets causes the demand for bonds to ________ and the demand curve to shift to the ________.
(Multiple Choice)
4.8/5 (34)
Everything else held constant, would an increase in volatility of stock prices have any impact on the demand for rare coins? Why or why not?
(Essay)
4.8/5 (41)
When the interest rate is above the equilibrium interest rate, there is an excess ________ money and the interest rate will ________.
(Multiple Choice)
5.0/5 (45)
If housing prices are expected to increase, then, other things equal, the demand for houses will ________ and that of Treasury bills will ________.
(Multiple Choice)
4.8/5 (46)
The demand curve for bonds has the usual downward slope, indicating that at ________ prices of the bond, everything else equal, the ________ is higher.
(Multiple Choice)
4.8/5 (37)
Filters
- Essay(0)
- Multiple Choice(0)
- Short Answer(0)
- True False(0)
- Matching(0)