Exam 11: Consumption, Real GDP, and the Multiplier
Exam 1: The Nature of Economics346 Questions
Exam 2: Scarcity and the World of Trade-Offs410 Questions
Exam 3: Demand and Supply448 Questions
Exam 4: Extensions of Demand and Supply Analysis398 Questions
Exam 5: Public Spending and Public Choice359 Questions
Exam 6: Funding the Public Sector201 Questions
Exam 7: The Macroeconomy: Unemployment, Inflation, and Deflation412 Questions
Exam 8: Global Economic Growth and Development282 Questions
Exam 9: Real GDP and the Price Level in the Long Run291 Questions
Exam 10: Classical and Keynesian Macro Analyses365 Questions
Exam 11: Consumption, Real GDP, and the Multiplier445 Questions
Exam 12: Fiscal Policy273 Questions
Exam 13: Deficit Spending and the Public Debt145 Questions
Exam 14: Money Banking and Central Banking516 Questions
Exam 15: Domestic and International Dimensions of Monetary Policy356 Questions
Exam 16: Stabilization in an Integrated World Economy305 Questions
Exam 17: Policies and Prospects for Global Economic Growth216 Questions
Exam 18: Comparative Advantage and the Open Economy314 Questions
Exam 19: Exchange Rates and the Balance of Payments300 Questions
Select questions type
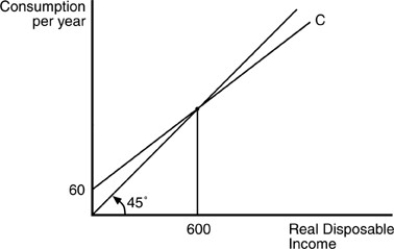 -In the above figure, when real disposable income is less than 600, then
Free
(Multiple Choice)
4.9/5  (43)
(43)
Correct Answer: Verified
B
The investment function will shift when there is a change in
Free
(Multiple Choice)
4.8/5 (31)
Correct Answer:Verified
B
At the point at which planned real consumption spending is equal to real disposable income
Free
(Multiple Choice)
4.7/5 (35)
Correct Answer:Verified
C
If the marginal propensity to consume (MPC)is 0.8, the multiplier will be
(Multiple Choice)
4.9/5 (33)
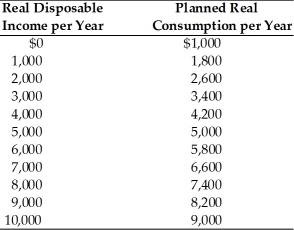 -In the above table, dissaving occurs at every level of income below
(Multiple Choice)
4.7/5 (33)
Consider a closed economy without a government and without international trade. What will be TRUE when this economy is in equilibrium?
(Multiple Choice)
4.9/5 (34)
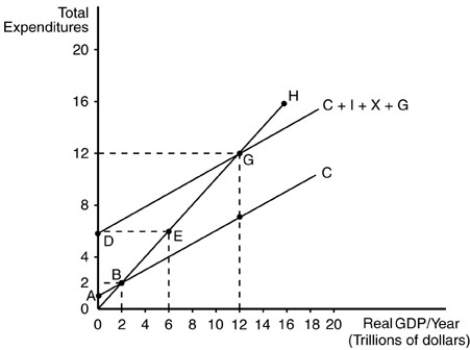 -Refer to the above figure. The equilibrium level of real Gross Domestic Product (GDP)is
(Multiple Choice)
4.7/5 (38)
Ignoring the government and foreign sectors, there is an unplanned decrease in inventories of $200 billion at the current level of real national income of $12 trillion. From this information, we know that
(Multiple Choice)
4.9/5 (40)
Suppose autonomous consumption decreases. This reduction in autonomous consumption will cause which of the following to occur?
(Multiple Choice)
4.8/5 (37)
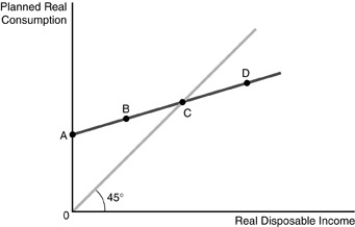 -Refer to the above figure. The figure represents the consumption function for a consumer. Point B represents
(Multiple Choice)
4.7/5 (33)
Which of the following would be expected to shift the consumption function up?
(Multiple Choice)
4.9/5 (35)
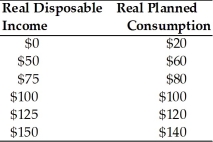 -Use the above table. Dissaving occurs up to a disposable income level of
(Multiple Choice)
4.7/5 (32)
-In the above figure, when disposable income is greater than 600
(Multiple Choice)
4.9/5 (45)
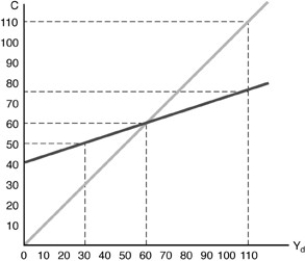 -Consider the above figure. The equation for the consumption function is
(Multiple Choice)
4.8/5 (42)
Filters
- Essay(0)
- Multiple Choice(0)
- Short Answer(0)
- True False(0)
- Matching(0)