Exam 3: Where Prices Come From: The Interaction of Demand and Supply
Exam 1: Economics: Foundations and Models459 Questions
Exam 2: Trade-Offs, Comparative Advantage, and the Market System495 Questions
Exam 3: Where Prices Come From: The Interaction of Demand and Supply476 Questions
Exam 4: Market Efficiency and Market Failure464 Questions
Exam 5: The Economics of Health Care337 Questions
Exam 6: Firms, The Stock Market, and Corporate Governance456 Questions
Exam 7: Consumer Choice and Elasticity384 Questions
Exam 8: Technology,Production,and Costs274 Questions
Exam 9: Firms in Perfectly Competitive Markets297 Questions
Exam 10: Monopoly and Antitrust Policy279 Questions
Exam 11: Monopolistic Competition and Oligopoly410 Questions
Exam 12: GDP: Measuring Total Production and Income261 Questions
Exam 13: Unemployment and Inflation290 Questions
Exam 14: Economic Growth, The Financial System, and Business Cycles251 Questions
Exam 15: Aggregate Demand and Aggregate Supply Analysis286 Questions
Exam 16: Money,Banks,and the Federal Reserve System278 Questions
Exam 17: Monetary Policy280 Questions
Exam 18: Fiscal Policy292 Questions
Exam 19: Comparative Advantage, International Trade, and Exchange Rates443 Questions
Select questions type
Table 3-4
Rest of Cashews Jordy's Amy's Market Market Tea Quantity Quantity Quantity Quantity Price per lb. Demanded Demanded Demanded Demanded (dollars) (lbs.) (lbs.) (lbs.) (lbs.) \ 10 1 1 50 8 2 3 70 6 3 5 95 4 5 9 128 2 8 14 156
-Refer to Table 3-4.The table above shows the demand schedules for cashews of two individuals (Jordy and Amy)and the rest of the market.If the price of cashews falls from $4 to $2,the market quantity demanded would
(Multiple Choice)
4.8/5  (35)
(35)
Which of the following would cause a decrease in the equilibrium price and an increase in the equilibrium quantity of salmon?
(Multiple Choice)
4.9/5 (36)
Market equilibrium occurs where the quantity supplied is equal to the quantity demanded.
(True/False)
4.7/5 (34)
Figure 3-8
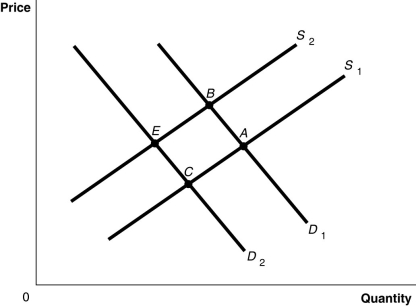 -Refer to Figure 3-8.The graph in this figure illustrates an initial competitive equilibrium in the market for apples at the intersection of D₁ and S₂ (point B) Which of the following changes would cause the equilibrium to change to point C?
(Multiple Choice)
4.9/5 (43)
Figure 3-2
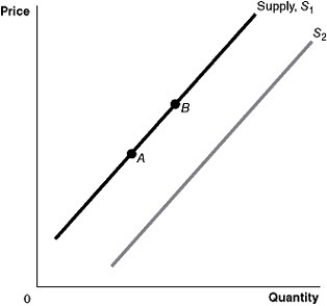 -Refer to Figure 3-2.An increase in the price of the product would be represented by a movement from
(Multiple Choice)
4.8/5 (37)
Table 3-2
Rest of Caviar Ari's Sonia's Market Market Tea Quantity Quantity Quantity Quantity Price per lb. Demanded Demanded Demanded Demanded (dollars) (oz.) (oz.)) (oz.) (oz.) \ 75 6 0 46 65 18 6 64 55 28 14 136 45 36 24 170 35 44 36 220
-Refer to Table 3-2.The table above shows the demand schedules for caviar of two individuals (Ari and Sonia)and the rest of the market.At a price of $75,the quantity demanded in the market would be
(Multiple Choice)
4.8/5 (36)
Assume that both the demand curve and the supply curve for MP3 players shift to the right but the supply curve shifts more than the demand curve.As a result
(Multiple Choice)
4.9/5 (29)
By drawing a demand curve with ________ on the vertical axis and ________ on the horizontal axis,economists assume that the most important determinant of the demand for a good is the ________ of the good.
(Multiple Choice)
4.8/5 (35)
Figure 3-4
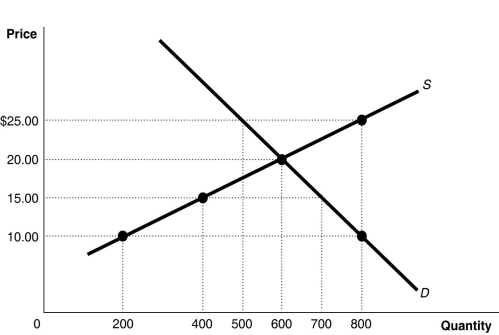 -Refer to Figure 3-4.At a price of $20,how many units will be sold?
(Multiple Choice)
4.9/5 (33)
Studies have shown links between calcium consumption and a reduction in osteoporosis.How does this affect the market for calcium?
(Multiple Choice)
4.8/5 (31)
Holding everything else constant,an increase in the price of MP3 players will result in
(Multiple Choice)
4.9/5 (41)
A surplus is defined as the situation that exists when the quantity of a good supplied is greater than the quantity demanded.
(True/False)
4.9/5 (36)
Ranchers can raise either cattle or sheep on their land.Which of the following would cause the supply of sheep to increase?
(Multiple Choice)
4.9/5 (30)
Assume that the price for swimming pool maintenance services has risen and sales of these services have fallen.One can conclude that
(Multiple Choice)
4.8/5 (39)
Figure 3-1
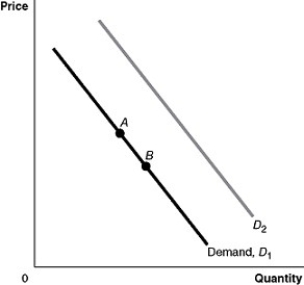 -Refer to Figure 3-1.An increase in the price of a complement would be represented by a movement from
(Multiple Choice)
4.9/5 (32)
Figure 3-7
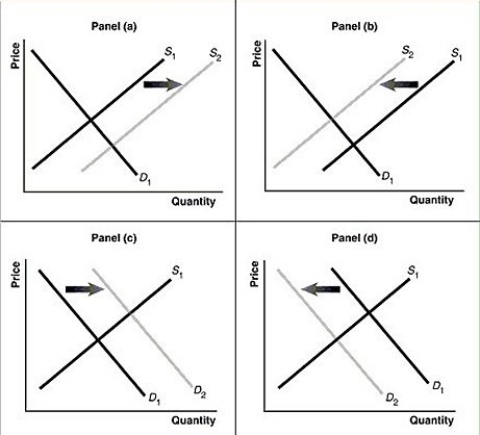 -Refer to Figure 3-7.Assume that the graphs in this figure represent the demand and supply curves for women's clothing.Which panel best describes what happens in this market when the wages of seamstresses rise?
(Multiple Choice)
4.9/5 (31)
Which of the following is evidence of a shortage of walnuts?
(Multiple Choice)
4.8/5 (33)
Filters
- Essay(0)
- Multiple Choice(0)
- Short Answer(0)
- True False(0)
- Matching(0)