Exam 19: Economic Inequality
Exam 1: What Is Economics479 Questions
Exam 2: The Economic Problem440 Questions
Exam 3: Demand and Supply515 Questions
Exam 4: Elasticity533 Questions
Exam 5: Efficiency and Equity450 Questions
Exam 6: Government Actions in Markets412 Questions
Exam 7: Global Markets in Action200 Questions
Exam 8: Utility and Demand364 Questions
Exam 9: Possibilities, Preferences, and Choices459 Questions
Exam 10: Organizing Production385 Questions
Exam 11: Output and Costs493 Questions
Exam 12: Perfect Competition487 Questions
Exam 13: Monopoly599 Questions
Exam 14: Monopolistic Competition319 Questions
Exam 15: Oligopoly276 Questions
Exam 16: Public Choices, Public Goods, and Healthcare205 Questions
Exam 17: Externalities437 Questions
Exam 18: Markets for Factors of Production382 Questions
Exam 19: Economic Inequality353 Questions
Exam 20: Uncertainty and Information233 Questions
Select questions type
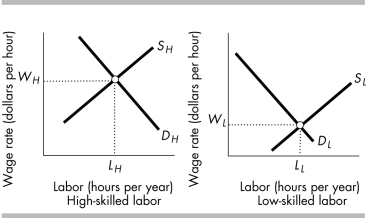
What factors explain why high-skilled workers are paid more than low-skilled workers?
Free
(Essay)
4.8/5  (34)
(34)
Correct Answer: Verified
High-skilled workers have a higher value of marginal product than that of low-skilled workers. This fact causes the demand for high-skilled labor to exceed that of low-skilled labor and is one reason why high-skilled workers' wages are higher than low-skilled workers' wages. In addition, high-skilled workers require compensation for having acquired the skill. Thus, the supply of high-skilled labor is less than the supply of low-skilled labor, which also causes the wages paid high-skilled workers to exceed those paid low-skilled labor.
In the United States, the Lorenz curve for wealth is ________ from the 45-degree line than is the Lorenz curve for income, which means that the distribution of wealth is more ________ than the distribution of income.
Free
(Multiple Choice)
4.9/5 (28)
Correct Answer:Verified
A
In the United States, do the poorest 20 percent of the households receive more or less than 5 percent of total income?
Free
(Essay)
4.8/5 (33)
Correct Answer:Verified
The poorest 20 percent of households receive less than 5 percent of total income.
Albert, Betty, and Cecile live in Norland. Their annual incomes and the amounts they pay in income tax are shown in the table below. 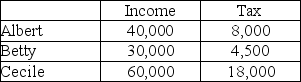 The income tax in Norland is
(Multiple Choice)
4.7/5 (26)
At any wage rate, the quantity of welders willing to work is less than the quantity of tomato pickers. Why?
(Essay)
5.0/5 (39)
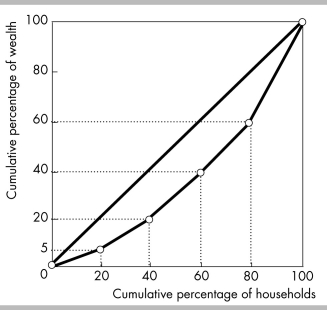 -The above figure shows the Lorenz curve for wealth for the nation of Rusha. The poorest forty percent of the population own what percent of wealth?
(Multiple Choice)
4.9/5 (36)
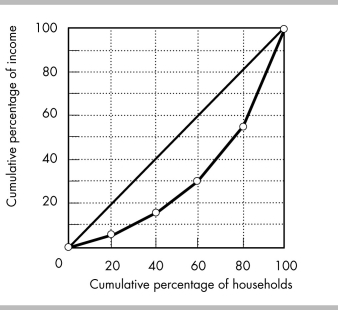 -In the figure above, the richest 20 percent of households receive ________ of total income.
(Multiple Choice)
4.8/5 (35)
Country A has a more equal distribution of income than country B if
(Multiple Choice)
4.7/5 (44)
The distribution of income in the United States is skewed so that the mode level of household income is ________ the median household income and the median household income is ________ than the mean household income.
(Multiple Choice)
5.0/5 (39)
What is "human capital"? How is it important in the determination of a worker's wage rate?
(Essay)
4.8/5 (39)
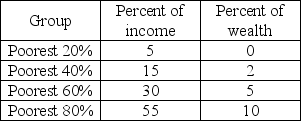 -The above table shows the distribution of wealth and income in Miseria. What percent of wealth is owned by the poorest twenty percent?
(Multiple Choice)
4.8/5 (41)
Pamela Michelle Scott, a low income single mom, had just finished her monthly shopping to purchase 30 days' worth of meat from Hollins Market. She's reared five healthy children and said that she made good use of the free health clinics and food stamps. Pamela benefits from free health clinics which are ________ and food stamps which is a ________.
(Multiple Choice)
4.8/5 (32)
-The above table shows the distribution of wealth and income in Miseria. With respect to income, the richest twenty percent of the population earn
(Multiple Choice)
4.8/5 (48)
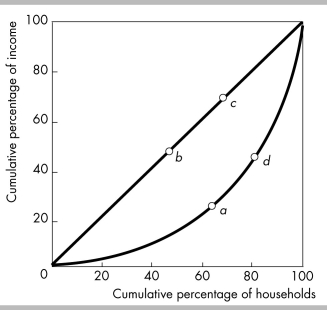 -In the above figure, if the Lorenz curve were to move closer to the diagonal line containing points b and c, the income distribution would be
(Multiple Choice)
4.7/5 (33)
 -In the above figure, an innovation that increases the demand for high-skilled workers and decreases the demand for low-skilled workers will
(Multiple Choice)
4.8/5 (33)
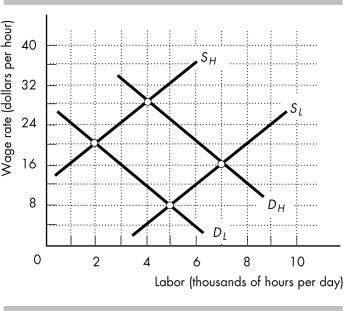 -In the figure above, in the market for low-skilled labor, the equilibrium wage rate is
(Multiple Choice)
4.8/5 (36)
Filters
- Essay(0)
- Multiple Choice(0)
- Short Answer(0)
- True False(0)
- Matching(0)