Exam 2: Trade-Offs, Comparative Advantage, and the Market System
Exam 1: Economics: Foundations and Models219 Questions
Exam 2: Trade-Offs, Comparative Advantage, and the Market System236 Questions
Exam 3: Where Prices Come From: The Interaction of Demand and Supply234 Questions
Exam 4: Economic Efficiency, Government Price Setting, and Taxes212 Questions
Exam 5: The Economics of Health Care166 Questions
Exam 6: Firms, the Stock Market, and Corporate Governance251 Questions
Exam 7: Comparative Advantage and the Gains From International Trade188 Questions
Exam 8: GDP: Measuring Total Production and Income260 Questions
Exam 9: Unemployment and Inflation289 Questions
Exam 10: Economic Growth, the Financial System, and Business Cycles251 Questions
Exam 11: Long-Run Economic Growth: Sources and Policies261 Questions
Exam 12: Aggregate Expenditure and Output in the Short Run304 Questions
Exam 13: Aggregate Demand and Aggregate Supply Analysis284 Questions
Exam 14: Money,Banks,and the Federal Reserve System276 Questions
Exam 15: Monetary Policy278 Questions
Exam 16: Fiscal Policy313 Questions
Exam 17: Inflation, Unemployment, and Federal Reserve Policy257 Questions
Exam 18: Macroeconomics in an Open Economy277 Questions
Exam 19: The International Financial System256 Questions
Select questions type
Table 2-7
 Table 2-7 shows the output per week of two people,Minnie and Mickey.They can either devote their time to making hats or making umbrellas.
-Refer to Table 2-7.What is Mickey's opportunity cost of making a hat?
Table 2-7 shows the output per week of two people,Minnie and Mickey.They can either devote their time to making hats or making umbrellas.
-Refer to Table 2-7.What is Mickey's opportunity cost of making a hat?
Free
(Multiple Choice)
4.7/5  (39)
(39)
Correct Answer: Verified
A
Figure 2-10 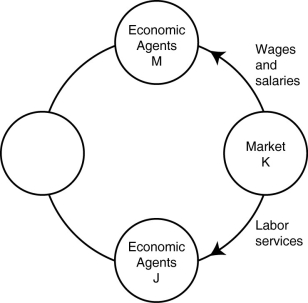 -Refer to Figure 2-10.In the circular flow diagram,market K represents
Free
(Multiple Choice)
4.8/5 (32)
Correct Answer:Verified
D
As job opportunities for women and the wages those jobs pay have increased,the opportunity cost of doing housework has ________,so many families have chosen to hire specialists in households chores,such as cleaning services and lawn care services,because the cost of these specialists is ________ than the cost of the wife (or husband)performing those chores.
Free
(Multiple Choice)
4.9/5 (39)
Correct Answer:Verified
B
Table 2-3
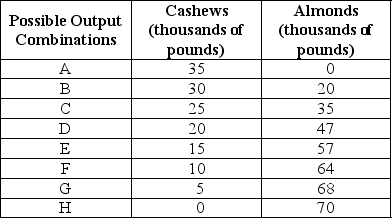 -Refer to Table 2-3.The Nut House produces only cashews and almonds.The table above shows the maximum possible output combinations of the two nuts using all resources and currently available technology.
a.Graph the Nut House's production possibilities frontier.Put almonds on the horizontal axis and cashews on the vertical axis.Be sure to identify the output combination points on your diagram.
b.Suppose the Nut House is currently producing at point C.What is the opportunity cost of producing an additional 12,000 pounds of almonds?
c.Suppose the Nut House is currently producing at point C.What happens to the opportunity cost of producing more and more almonds? Does it increase,decrease or remain constant? Explain your answer.
d.Suppose the Nut House is currently producing at point F.What happens to the opportunity cost of producing more and more cashews? Does it increase,decrease or remain constant? Explain your answer.
e.Suppose the Nut House is plagued by a variety of white root-rot disease,which destroys cashew trees but not almond trees.Show in a graph what happens to its PPF.
-Refer to Table 2-3.The Nut House produces only cashews and almonds.The table above shows the maximum possible output combinations of the two nuts using all resources and currently available technology.
a.Graph the Nut House's production possibilities frontier.Put almonds on the horizontal axis and cashews on the vertical axis.Be sure to identify the output combination points on your diagram.
b.Suppose the Nut House is currently producing at point C.What is the opportunity cost of producing an additional 12,000 pounds of almonds?
c.Suppose the Nut House is currently producing at point C.What happens to the opportunity cost of producing more and more almonds? Does it increase,decrease or remain constant? Explain your answer.
d.Suppose the Nut House is currently producing at point F.What happens to the opportunity cost of producing more and more cashews? Does it increase,decrease or remain constant? Explain your answer.
e.Suppose the Nut House is plagued by a variety of white root-rot disease,which destroys cashew trees but not almond trees.Show in a graph what happens to its PPF.
(Essay)
4.8/5 (36)
Table 2-5
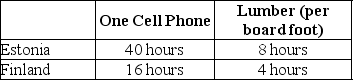 Table 2-5 shows the number of labor hours required to produce a cell phone and a board foot of lumber in Estonia and Finland.
-Refer to Table 2-5.Does either Estonia or Finland have an absolute advantage and if so,in what product?
Table 2-5 shows the number of labor hours required to produce a cell phone and a board foot of lumber in Estonia and Finland.
-Refer to Table 2-5.Does either Estonia or Finland have an absolute advantage and if so,in what product?
(Multiple Choice)
4.9/5 (35)
Figure 2-8 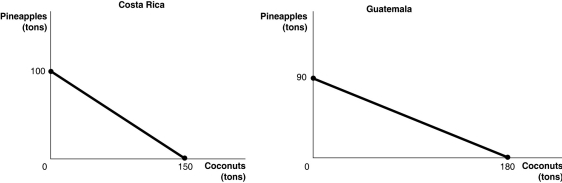 Figure 2-8 shows the production possibilities frontiers for Costa Rica and Guatemala.Each country produces two goods,pineapples and coconuts.
-Refer to Figure 2-8.Which country has a comparative advantage in the production of pineapples?
Figure 2-8 shows the production possibilities frontiers for Costa Rica and Guatemala.Each country produces two goods,pineapples and coconuts.
-Refer to Figure 2-8.Which country has a comparative advantage in the production of pineapples?
(Multiple Choice)
4.9/5 (39)
Figure 2-4 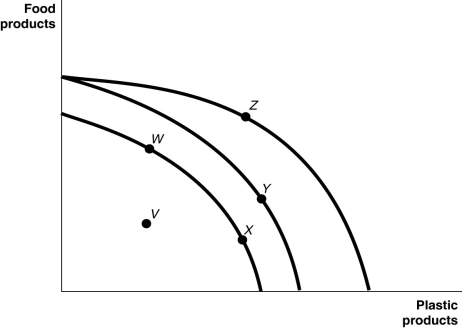 Figure 2-4 shows various points on three different production possibilities frontiers for a nation.
-Refer to Figure 2-4.Consider the following events: a.a decrease in the unemployment rate
B.an increase in technology with respect to both food and plastic production
C.a war that kills a significant portion of a nation's population
Which of the events listed above could cause a movement from W to Y?
Figure 2-4 shows various points on three different production possibilities frontiers for a nation.
-Refer to Figure 2-4.Consider the following events: a.a decrease in the unemployment rate
B.an increase in technology with respect to both food and plastic production
C.a war that kills a significant portion of a nation's population
Which of the events listed above could cause a movement from W to Y?
(Multiple Choice)
4.8/5 (38)
Figure 2-5 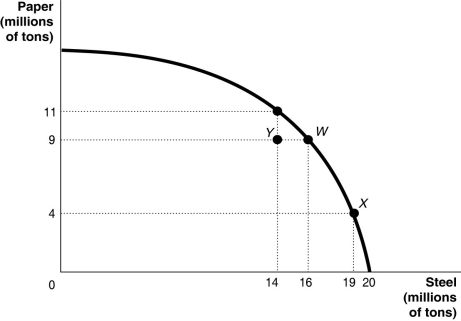 -Refer to Figure 2-5.If the economy is currently producing at point W,what is the opportunity cost of moving to point Y?
(Multiple Choice)
4.9/5 (34)
Figure 2-3 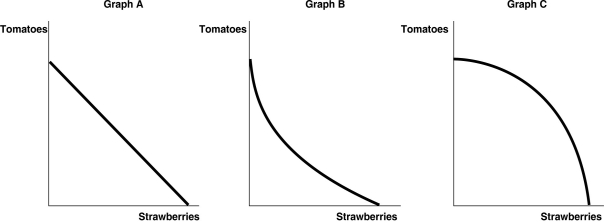 -Refer to Figure 2-3.Carlos Vanya grows tomatoes and strawberries on his land.His land is equally suited for growing either fruit.Which of the graphs in Figure 2-3 represents his production possibilities frontier?
(Multiple Choice)
4.9/5 (27)
Figure 2-4 Figure 2-4 shows various points on three different production possibilities frontiers for a nation.
-Refer to Figure 2-4.Consider the following events: a.an increase in the unemployment rate
B.general technological advancement
C.an increase in consumer wealth
Which of the events listed above could cause a movement from Z to V?
(Multiple Choice)
4.8/5 (32)
Table 2-9
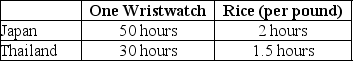 Table 2-9 shows the number of labor hours required to produce a wristwatch and a pound of rice in Japan and Thailand.
-Refer to Table 2-9.Does either Japan or Thailand have an absolute advantage and if so,in what product?
Table 2-9 shows the number of labor hours required to produce a wristwatch and a pound of rice in Japan and Thailand.
-Refer to Table 2-9.Does either Japan or Thailand have an absolute advantage and if so,in what product?
(Multiple Choice)
4.7/5 (36)
Table 2-8
 Table 2-8 shows the output per month of two people,Wilma and Betty.They can either devote their time to making marble statues or making marble benches.
-Refer to Table 2-8.What is Wilma's opportunity cost of making a statue?
Table 2-8 shows the output per month of two people,Wilma and Betty.They can either devote their time to making marble statues or making marble benches.
-Refer to Table 2-8.What is Wilma's opportunity cost of making a statue?
(Multiple Choice)
4.8/5 (34)
Which of the following are represented by the same flow in the circular flow model?
(Multiple Choice)
4.8/5 (28)
The recession of 2007-2009 would most likely be represented in a production possibilities frontier graph by
(Multiple Choice)
4.9/5 (30)
When a celebrity has the desire to have his image protected following his death,this is best described as an example of the protection of
(Multiple Choice)
4.7/5 (42)
A decrease in the unemployment rate may be represented as a movement from a point inside the production possibilities frontier to a point on the frontier.
(True/False)
5.0/5 (36)
Figure 2-4 Figure 2-4 shows various points on three different production possibilities frontiers for a nation.
-Refer to Figure 2-4.A movement from ________ could occur because of an influx of immigrant labor.
(Multiple Choice)
4.9/5 (31)
Table 2-6
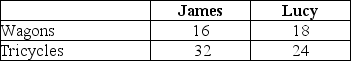 Table 2-6 shows the output per week of two people,James and Lucy.They can either devote their time to making wagons or making tricycles.
-Refer to Table 2-6.Which of the following statements is true?
Table 2-6 shows the output per week of two people,James and Lucy.They can either devote their time to making wagons or making tricycles.
-Refer to Table 2-6.Which of the following statements is true?
(Multiple Choice)
4.8/5 (29)
Figure 2-9 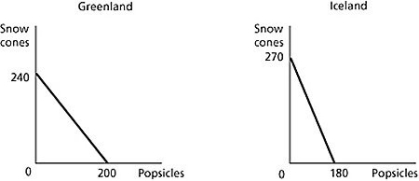 Figure 2-9 shows the production possibilities frontiers for Greenland and Iceland.Each country produces two goods,snow cones and popsicles.
-Refer to Figure 2-9.What is the opportunity cost of producing 1 snow cone in Iceland?
Figure 2-9 shows the production possibilities frontiers for Greenland and Iceland.Each country produces two goods,snow cones and popsicles.
-Refer to Figure 2-9.What is the opportunity cost of producing 1 snow cone in Iceland?
(Multiple Choice)
4.9/5 (32)
Filters
- Essay(0)
- Multiple Choice(0)
- Short Answer(0)
- True False(0)
- Matching(0)