Exam 5: The Behavior of Interest Rates
Exam 1: Why Study Money, Banking, and Financial Markets102 Questions
Exam 2: An Overview of the Financial System127 Questions
Exam 3: What Is Money95 Questions
Exam 4: Understanding Interest Rates93 Questions
Exam 5: The Behavior of Interest Rates149 Questions
Exam 6: The Risk and Term Structure of Interest Rates102 Questions
Exam 7: The Stock Market, the Theory of Rational Expectations, and the Efficient Market Hypothesis91 Questions
Exam 8: An Economic Analysis of Financial Structure94 Questions
Exam 9: Financial Crises and the Subprime Meltdown60 Questions
Exam 10: Banking and the Management of Financial Institutions140 Questions
Exam 11: Economic Analysis of Financial Regulation105 Questions
Exam 12: Banking Industry: Structure and Competition127 Questions
Exam 13: Central Banks and the Federal Reserve System102 Questions
Exam 14: The Money Supply Process228 Questions
Exam 15: Tools for Monetary Policy116 Questions
Exam 16: The Conduct of Monetary Policy: Strategy and Tactics91 Questions
Exam 17: The Foreign Exchange Market123 Questions
Exam 18: The International Financial System137 Questions
Exam 19: The Demand for Money110 Questions
Exam 20: The Islm Model131 Questions
Exam 21: Monetary and Fiscal Policy in the ISLM Model124 Questions
Exam 22: Aggregate Demand and Supply Analysis81 Questions
Exam 23: Transmission Mechanisms of Monetary Policy: The Evidence88 Questions
Exam 24: Money and Inflation92 Questions
Exam 25: Rational Expectations: Implications for Policy56 Questions
Select questions type
Use the following figure to answer the questions :
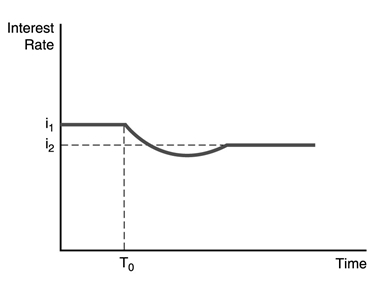 -The figure above illustrates the effect of an increased rate of money supply growth at time period T0.From the figure,one can conclude that the
Free
(Multiple Choice)
4.8/5  (34)
(34)
Correct Answer: Verified
A
Use the following figure to answer the questions :
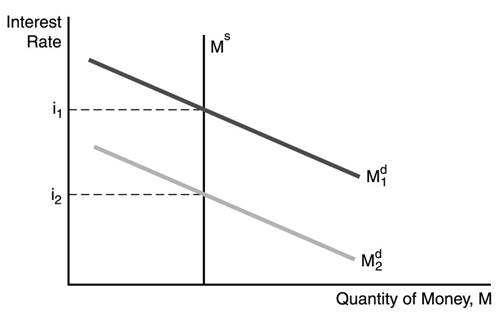 -In the figure above,one factor not responsible for the decline in the demand for money is
Free
(Multiple Choice)
4.8/5 (38)
Correct Answer:Verified
C
In Keynes's liquidity preference framework,if there is excess demand for money,there is
Free
(Multiple Choice)
5.0/5 (25)
Correct Answer:Verified
C
In contrast to the CAPM ,the APT assumes that there can be several sources of ________ that cannot be eliminated through diversification.
(Multiple Choice)
4.8/5 (36)
Everything else held constant,when households save less,wealth and the demand for bonds ________ and the bond demand curve shifts ________.
(Multiple Choice)
4.8/5 (34)
Discovery of new gold in Alaska will ________ the ________ of gold,________ its price,everything else held constant.
(Multiple Choice)
4.8/5 (41)
Factors that can cause the supply curve for bonds to shift to the right include
(Multiple Choice)
4.9/5 (43)
________ in the money supply creates excess ________ money,causing interest rates to ________,everything else held constant.
(Multiple Choice)
4.9/5 (25)
When rare coin prices become volatile,the ________ curve for bonds shifts to the ________,everything else held constant.
(Multiple Choice)
4.8/5 (39)
Use the following figure to answer the questions :
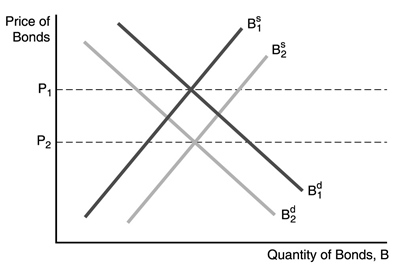 -In the figure above,the price of bonds would fall from P1 to P2
(Multiple Choice)
4.7/5 (42)
In Keynes's liquidity preference framework,individuals are assumed to hold their wealth in two forms:
(Multiple Choice)
4.9/5 (33)
You would be more willing to buy AT&T bonds (holding everything else constant)if
(Multiple Choice)
4.8/5 (37)
If the price of gold becomes less volatile,then,other things equal,the demand for stocks will ________ and the demand for antiques will ________.
(Multiple Choice)
4.9/5 (43)
Holding many risky assets and thus reducing the overall risk an investor faces is called
(Multiple Choice)
4.8/5 (43)
Use the following figure to answer the questions :
-In the figure above,the decrease in the interest rate from i1 to i2 can be explained by
(Multiple Choice)
4.8/5 (49)
Holding all other factors constant,the quantity demanded of an asset is
(Multiple Choice)
4.8/5 (38)
When the Fed ________ the money stock,the money supply curve shifts to the ________ and the interest rate ________,everything else held constant.
(Multiple Choice)
4.7/5 (33)
Filters
- Essay(0)
- Multiple Choice(0)
- Short Answer(0)
- True False(0)
- Matching(0)