Exam 17: Externalities and Public Goods
Exam 1: Analyzing Economic Problems48 Questions
Exam 2: Demand and Supply Analysis69 Questions
Exam 3: Consumer Preferences and the Concept of Utility61 Questions
Exam 4: Consumer Choice57 Questions
Exam 5: The Theory of Demand66 Questions
Exam 6: Inputs and Production Functions70 Questions
Exam 7: Costs and Cost Minimization64 Questions
Exam 8: Cost Curves68 Questions
Exam 9: Perfectly Competitive Markets57 Questions
Exam 10: Competitive Markets67 Questions
Exam 11: Monopoly and Monopsony66 Questions
Exam 12: Capturing Surplus58 Questions
Exam 13: Market Structure and Competition61 Questions
Exam 14: Game Theory and Strategic Behavior51 Questions
Exam 15: Risk and Information63 Questions
Exam 16: General Equilibrium Theory56 Questions
Exam 17: Externalities and Public Goods55 Questions
Select questions type
An environmental economic consulting firm is hired to measure the negative externalities associated with the pollution from an industry.The consultants calculate the marginal social cost of production to be MSC = 2Q+30 and the marginal private cost of production to be  +30.The market demand curve can be expressed as
  If the consultants have accurately measured the impact of the pollution externality,the deadweight loss from producing at the market equilibrium is
(Multiple Choice)
4.9/5  (32)
(32)
To move closer to the social optimum when a negative externality exists, the cost to society of the externality should be
(Multiple Choice)
4.7/5 (39)
Which of the following is not a good example of common property?
(Multiple Choice)
4.7/5 (40)
Which of the following is a real-world example of a negative externality?
(Multiple Choice)
4.8/5 (37)
When the market for product Y includes a positive externality,
(Multiple Choice)
4.7/5 (33)
When the market for product X includes a negative externality,
(Multiple Choice)
4.7/5 (34)
In the diagram below,the external cost savings from producing at the socially optimal quantity rather than at the private equilibrium can be represented as: 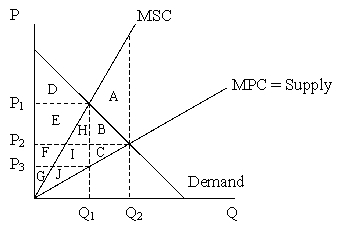
(Multiple Choice)
4.8/5 (35)
Suppose that an industry emits a chemical that pollutes the ground water.Without considering the effects of the pollution,the industry has a marginal private cost curve of MPC = Q+30.The market demand curve is  ,while the marginal social cost curve is MSC = 2Q + 30.How can the optimal level of emissions fee best be depicted on a graph in this problem?
(Multiple Choice)
4.9/5 (39)
An environmental economic consulting firm is hired to measure the negative externalities associated with the pollution from an industry.The consultants calculate the marginal social cost of production to be MSC = 2Q+30 and the marginal private cost of production to be  +30.The market demand curve for the industry can be expressed as P = 60-Q.What is the socially optimal level of output?
(Multiple Choice)
4.9/5 (39)
Filters
- Essay(0)
- Multiple Choice(0)
- Short Answer(0)
- True False(0)
- Matching(0)