Exam 17: Quality Management
Exam 1: Overview of Statistics52 Questions
Exam 2: Data Collection111 Questions
Exam 3: Describing Data Visually108 Questions
Exam 4: Descriptive Statistics150 Questions
Exam 5: Probability123 Questions
Exam 6: Discrete Probability Distributions126 Questions
Exam 7: Continuous Probability Distributions120 Questions
Exam 8: Sampling Distributions and Estimation106 Questions
Exam 9: One-Sample Hypothesis Tests147 Questions
Exam 10: Two-Sample Hypothesis Tests113 Questions
Exam 11: Analysis of Variance126 Questions
Exam 12: Simple Regression135 Questions
Exam 13: Multiple Regression130 Questions
Exam 14: Time Series Analysis114 Questions
Exam 15: Chi-Square Tests99 Questions
Exam 16: Nonparametric Tests85 Questions
Exam 17: Quality Management108 Questions
Select questions type
A process may be in a state of control even if one sample mean is more than two standard deviations above the centerline.
Free
(True/False)
4.8/5  (43)
(43)
Correct Answer: Verified
True
In general terms, a capable process is one whose variability (σ) is small in relation to the distance between the centerline μ and the upper and lower specification limits.
Free
(True/False)
4.8/5 (35)
Correct Answer:Verified
True
Professor Murphy wants to set up a control chart to monitor the percentage of absenteeism in his introductory statistics course (50 students are registered). Absences per period for the last 15 class sessions are in the table below. Session 1 2 3 4 5 6 7 8 9 10 11 12 13 14 15 Absent 5 0 2 2 3 8 10 3 5 5 1 2 0 2 3 Calculate the empirical centerline for a p-chart to track absences.
Free
(Multiple Choice)
4.7/5 (31)
Correct Answer:Verified
A
Professor Murphy wants to set up a control chart to monitor the percentage of absenteeism in his introductory statistics course (50 students are registered). Absences per period for the last 15 class sessions are in the table below. Session 1 2 3 4 5 6 7 8 9 10 11 12 13 14 15 Absent 5 0 2 2 3 8 10 3 5 5 1 2 0 2 3 Using 3 sigma limits, calculate lower and upper control limits for a p-chart to track absences.
(Multiple Choice)
4.7/5 (35)
In manufacturing, if workers readjust the equipment after each sample, it would typically:
(Multiple Choice)
4.8/5 (31)
The Cp index equals the Cpk index if USL = 550, LSL = 540, μ = 546, and σ = 1.25.
(True/False)
4.7/5 (38)
What does the second letter mean in the Six-Sigma DMAIC acronym?
(Multiple Choice)
4.8/5 (39)
Control charts are used to monitor the quality of a product before it is produced.
(True/False)
4.9/5 (28)
In statistical process control, the Cpk index measures the separate distances between the centerline μ and the USL and LSL.
(True/False)
4.8/5 (39)
A control chart for the mean tells whether the product conforms to specifications.
(True/False)
4.7/5 (32)
As a rule of thumb, if a process Cpk index is less than 1.00, the level of process capability is usually judged acceptable.
(True/False)
4.9/5 (37)
Which of the following is not a characteristic of Total Quality Management?
(Multiple Choice)
4.8/5 (41)
Find the Cpk index for a process with USL = 550, LSL = 540, μ = 544, and σ = 1.25.
(Multiple Choice)
4.9/5 (35)
Given the following control chart, which problem is most likely? 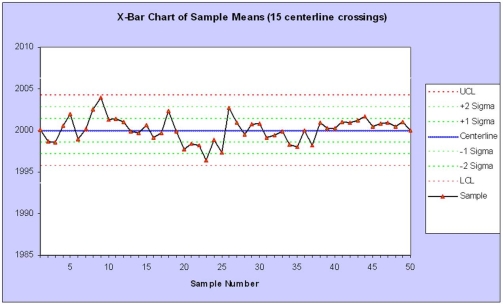
(Multiple Choice)
4.8/5 (27)
Special cause variation exists when the process produces observations that are not from the same population as the majority of the observations.
(True/False)
4.9/5 (33)
Filters
- Essay(0)
- Multiple Choice(0)
- Short Answer(0)
- True False(0)
- Matching(0)