Exam 7: The Analysis of Consumer Choice
The quantity demanded of handheld calculators, a normal good, will _______ with a price _______ .
C
Which of the following statements is (are) true?
D
In the early 1970s, the handheld calculator came out on the market.Before that time, the desktop calculator was an important item for those who had to make calculations.Use the theory of consumer maximizing behavior to explain what happened in the desktop calculator market and the handheld calculator market since then.
The theory of consumer maximizing behavior suggests that individuals aim to get the most value for their money by purchasing goods and services that offer the greatest utility relative to their cost. When the handheld calculator was introduced in the early 1970s, it represented a significant technological advancement over the desktop calculator, primarily in terms of size, portability, and eventually, cost.
Initially, the desktop calculator was an essential tool for businesses, scientists, engineers, and students who needed to perform complex calculations. These calculators were relatively large, expensive, and not easily portable. However, they were the best available technology for calculation-intensive tasks.
With the advent of the handheld calculator, consumers were presented with a new option that offered several advantages:
1. Portability: Handheld calculators could easily be carried around, making them convenient for use in various settings, from classrooms to business meetings.
2. Affordability: As technology advanced and production costs decreased, handheld calculators became more affordable for the average consumer. This price reduction increased their accessibility and appeal.
3. Functionality: Early handheld calculators may have had fewer features than their desktop counterparts, but over time, they became more sophisticated, incorporating many of the functions previously only available on desktop models.
4. Ease of Use: Handheld calculators were designed to be user-friendly, with intuitive interfaces that made them easier to use than some of the more complex desktop calculators.
According to the theory of consumer maximizing behavior, as handheld calculators improved and became more cost-effective, consumers would naturally gravitate towards them. This shift in consumer preference would lead to a decrease in demand for desktop calculators. Manufacturers would respond to this change by focusing more on the production and development of handheld models, further innovating in that space to capture the market.
Over time, the market for desktop calculators would shrink as handheld calculators dominated the market. This would be reflected in reduced production, fewer models available, and potentially higher prices for the remaining desktop calculators due to lower economies of scale.
In the long run, the desktop calculator market would likely become a niche market, catering to specific professional needs that require more robust computing power or specialized functions that handheld calculators do not provide. Meanwhile, the handheld calculator market would expand, with manufacturers competing on features, design, and price, continually seeking to meet the evolving needs and preferences of consumers.
In summary, the introduction of the handheld calculator led to a shift in consumer behavior, with preferences moving away from the less convenient and often more expensive desktop calculators to the more portable, affordable, and user-friendly handheld devices. This shift was driven by the desire of consumers to maximize their utility, which in turn reshaped the calculator market over the subsequent decades.
Economists identify the satisfaction a person derives from the consumption of goods and services as:
Combinations of two goods that yield equal levels of utility are shown on a(n) _______ curve.
The change in consumption of a good resulting from the implicit change in income because of a price change is called the _______ effect of a price change.
Use the following to answer question(s): Consumer Equilibrium 2
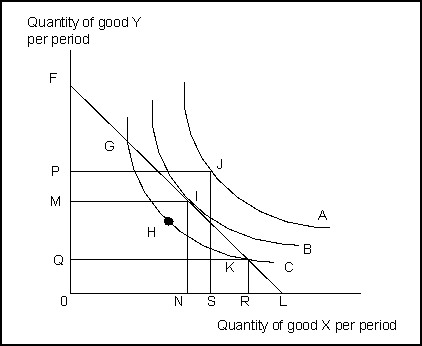 -(Exhibit: Consumer Equilibrium 2) Given the exhibit and the budget constraint, the maximization of consumer utility would occur at point _______ with the consumption of _______ of X and _______ of Y.
Following an income-compensated price change, you decide to decrease the quantity of ice cream purchased each month when the price increases and purchase more frozen yogurt instead.This is an indication of the:
John Smedley, a careful maximizer of utility, consumes only two goods, peanut butter and broccoli.He had just achieved the utility maximizing solution in his consumption of the two goods when the price of broccoli rose.As he adjusts to this event, he will consume:
Faced with two goods to buy, good 1 and good 2, a utility-maximizing individual will buy according to which of the following statements?
If the price of a good rises, the resulting decrease in the quantity purchased will increase the marginal utility of the good.
It is through a consumer's reaction to different _______ that we can trace the consumer's ________ curve for a good.
The total utility of a good is equal to the marginal utility of the last unit consumed.
A demand curve is generated from indifference curves by changing:
Define total and marginal utility.Explain the relationship between them.If marginal utility is positive, negative, or zero, and is "going in a particular direction," what is the magnitude of total utility and what direction is it going? Explain carefully.
In the case of inferior goods, the substitution effect and the income effect:
An inferior good is likely to be a(n) _______ good that people _______ .
The maximum amount of one good a consumer would be willing to give up in order to obtain an additional unit of another is called the:
Filters
- Essay(0)
- Multiple Choice(0)
- Short Answer(0)
- True False(0)
- Matching(0)