Exam 37: Extending the Analysis of Aggregate Supply
Exam 22: Income Inequality Poverty and Discrimination137 Questions
Exam 23: Health Care113 Questions
Exam 24: Immigration88 Questions
Exam 25: An Introduction to Macroeconomics99 Questions
Exam 26: Measuring Domestic Output and National Income169 Questions
Exam 27: Economic Growth129 Questions
Exam 28: Business Cycles, Unemployment, and Inflation134 Questions
Exam 29: Basic Macroeconomic Relationships150 Questions
Exam 30: The Aggregate Expenditures Model175 Questions
Exam 31: Aggregate Demand and Aggregate Supply123 Questions
Exam 32: The Balance of Payments, Exchange Rates, and Trade Deficits138 Questions
Exam 33: Money, Banking, and Financial Institutions134 Questions
Exam 34: Money Creation123 Questions
Exam 35: Interest Rates and Monetary Policy217 Questions
Exam 36: Financial Economics177 Questions
Exam 37: Extending the Analysis of Aggregate Supply71 Questions
Exam 38: Current Issues in Macro Theory and Policy123 Questions
Exam 39: International Trade132 Questions
Exam 40: The Balance of Payments, Exchange Rates, and Trade Deficits138 Questions
Exam 41: The Economics of Developing Countries102 Questions
Exam 42: The United States and the Global Economy127 Questions
Select questions type
The level of potential output and location of the long-run aggregate supply curve are determined by:
(Multiple Choice)
4.9/5  (37)
(37)
Other things equal,the short-run aggregate supply curve shifts positions when:
(Multiple Choice)
4.7/5 (31)
The Phillips Curve suggests an inverse relationship between increases in the price level and the level of employment.
(True/False)
4.8/5 (38)
When the actual rate of inflation exceeds the expected rate:
(Multiple Choice)
4.9/5 (26)
In terms of aggregate supply,the difference between the long run and the short run is that in the long run:
(Multiple Choice)
4.9/5 (37)
Which of the following is a tenet of supply-side economics?
(Multiple Choice)
4.9/5 (34)
When the actual rate of inflation is less than the expected rate:
(Multiple Choice)
5.0/5 (36)
In terms of aggregate supply,a period in which nominal wages and other resource prices are unresponsive to price-level changes is called the:
(Multiple Choice)
4.9/5 (39)
In terms of aggregate supply,a period in which nominal wages and other resource prices are fully responsive to price-level changes is called the:
(Multiple Choice)
4.9/5 (40)
The short-run aggregate supply curve is vertical and the long-run aggregate supply curve is horizontal.
(True/False)
4.9/5 (38)
In 1993 the federal government boosted income tax rates.In the seven years that followed:
(Multiple Choice)
4.8/5 (43)
Answer the question on the basis of the following economic data for a hypothetical economy: Year 1997 1998 1999 2000 Average Hourly Wage \ 6.40 6.72 7.24 8.02 Index of Industrial 197 199 196 192 Unemployment 5.5\% 5.8 7.2 8.3 Price Level 130 133 139 147 Rate of Increase in 3.0\% 2.9 3.1 2.8
The given data indicate that the economy has entered a period of demand-pull inflation.
(True/False)
4.8/5 (40)
Suppose the full employment level of real output (Q)for a hypothetical economy is $500,the price level (P)initially is 100,and prices and wages are flexible both upward and downward.Use the following short-run aggregate supply schedules to answer the question. 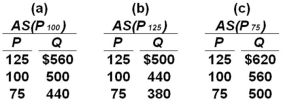 Refer to the information given.If the price level unexpectedly declines from 100 to 75,the level of real output in the short run will:
(Multiple Choice)
4.7/5 (41)
Government can push the unemployment rate below the natural rate only by:
(Multiple Choice)
5.0/5 (33)
The basic problem portrayed by the traditional Phillips Curve is:
(Multiple Choice)
4.8/5 (31)
Filters
- Essay(0)
- Multiple Choice(0)
- Short Answer(0)
- True False(0)
- Matching(0)