Exam 5: Using Consumer Choice Theory
Exam 1: An Introduction to Microeconomics95 Questions
Exam 2: Supply and Demand94 Questions
Exam 3: The Theory of Consumer Choice75 Questions
Exam 4: Individual and Market Demand100 Questions
Exam 5: Using Consumer Choice Theory85 Questions
Exam 6: Exchange, Efficiency, and Prices79 Questions
Exam 7: Production112 Questions
Exam 8: The Cost of Production121 Questions
Exam 9: Profit Maximization in Perfectly Competitive Markets97 Questions
Exam 10: Using the Competitive Model96 Questions
Exam 11: Monopoly112 Questions
Exam 12: Product Pricing With Monopoly Power89 Questions
Exam 13: Monopolistic Competition and Oligopoly98 Questions
Exam 14: Game Theory and the Economics of Information88 Questions
Exam 15: Using Noncompetitive Market Models78 Questions
Exam 16: Employment and Pricing of Inputs99 Questions
Exam 17: Wages, Rent, Interest, and Profit92 Questions
Exam 18: Using Input Market Analysis83 Questions
Exam 19: General Equilibrium Analysis and Economic Efficiency95 Questions
Exam 20: Public Goods and Externalities102 Questions
Select questions type
Consider a two-year period where a consumer has an income of $10,000 in year 1 and $8,000 in year 2.The consumer can borrow or lend at a rate of 10 percent.If the consumer decides to save $1,000 in year 1,it means:
(Multiple Choice)
4.8/5  (40)
(40)
Consider the income and consumption of an individual between two time periods.If consumption in period 2 (C2)is on the horizontal axis,consumption in period 1 (C1)is on the vertical axis,and the interest rate is 11 percent,the slope of the budget constraint must be _____.
(Multiple Choice)
4.8/5 (38)
All-you-can-eat restaurants charge a fixed price that permits unlimited access to prepared food.Suppose food consumption is on the horizontal axis and all other goods on the vertical axis.If the restaurant charges $10 per meal while the price of all other goods is $20,restaurant patrons will consume to a point on their indifference curve where their marginal rate of substitution of food for all other goods is equal to _____.
(Multiple Choice)
5.0/5 (36)
Which of the following leads to the diversification of risk?
(Multiple Choice)
4.9/5 (39)
If an equal-cost lump-sum transfer were substituted for a per unit excise subsidy on good X:
(Multiple Choice)
4.8/5 (31)
Assume an indifference map with other goods on the vertical axis and health on the horizontal axis.The government provides families with $400 vouchers that can be redeemed for healthcare services at any hospital,public or private.The budget line for a family that avails this voucher scheme will:
(Multiple Choice)
4.9/5 (31)
An excise subsidy given on clothing will encourage consumers to purchase:
(Multiple Choice)
4.7/5 (39)
Figure 5-1 shows the preferences of a consumer for food and other goods.He is initially in equilibrium at point A where the budget line MN is tangent to the indifference curve.
Figure 5-1  -In Figure 5-1,the total outlay on food before the excise subsidy is given by _____.
(Multiple Choice)
4.8/5 (29)
Figure 5-1 shows the preferences of a consumer for food and other goods.He is initially in equilibrium at point A where the budget line MN is tangent to the indifference curve.
Figure 5-1
-In Figure 5-1,after the excise subsidy the total consumption of other goods increases by _____.
(Multiple Choice)
4.8/5 (28)
(
A)Doug is 51 years old.He owns a Laundromat and plans to retire at the age of 60.Pete is 21 years old.He just started working at an investment bank.The figure shows the preferences for future and present consumption for an individual.Other things unchanged,who is more likely to be at point N on the budget line and why? 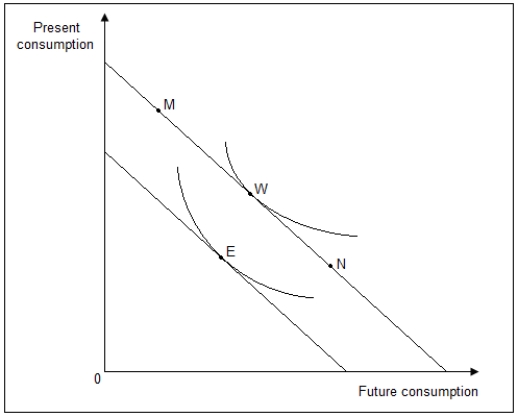
(Essay)
4.8/5 (39)
Figure 5-1 shows the preferences of a consumer for food and other goods.He is initially in equilibrium at point A where the budget line MN is tangent to the indifference curve.
Figure 5-1
-In Figure 5-1,the total cost incurred by the government on the lump-sum transfer is given by _____.
(Multiple Choice)
4.9/5 (36)
When comparing T-bills and stocks,a risk-averse investor may choose to invest in T-bills although stocks give higher average returns because _____.
(Multiple Choice)
4.9/5 (40)
Compared to an equal-cost cash grant,an excise subsidy on clothing results in the purchase of:
(Multiple Choice)
4.8/5 (43)
A subsidy can actually cause the consumption of subsidized goods to fall if:
(Multiple Choice)
4.9/5 (30)
In the intertemporal consumer choice model,an increase in _____ will alter the slope of the budget line.
(Multiple Choice)
4.8/5 (32)
Walter works for a large firm that produces software and has a capitalized value of $10 billion.This firm pays its employees,in part,with the company's stock,compensating Walter an additional thirty percent of his $50,000 annual salary worth of the company's stock.Which of the following is true?
(Multiple Choice)
4.9/5 (28)
An individual is considering consumption in two periods.He has decided to borrow $1,000 in period 1,given his endowment and the interest rate.Other things remaining the same,if the interest rate increases,he will:
(Multiple Choice)
4.8/5 (39)
Figure 5-1 shows the preferences of a consumer for food and other goods.He is initially in equilibrium at point A where the budget line MN is tangent to the indifference curve.
Figure 5-1
-Refer to Figure 5-1.From the initial point of equilibrium,an excise subsidy will move the consumer to point _____.
(Multiple Choice)
4.8/5 (35)
Figure 5-2 shows the quantity demanded of a good at various prices.  -Based on Figure 5-2,the welfare cost of an excise tax (that raises price from P2 to P1)is the area _____.
(Multiple Choice)
4.8/5 (45)
Filters
- Essay(0)
- Multiple Choice(0)
- Short Answer(0)
- True False(0)
- Matching(0)