Exam 9: Aggregate Demand
Exam 1: Economics: The Core Issues141 Questions
Exam 2: The Us Economy: A Global View151 Questions
Exam 3: Supply and Demand157 Questions
Exam 4: The Role of Government150 Questions
Exam 5: National Income Accounting153 Questions
Exam 6: Unemployment151 Questions
Exam 7: Inflation151 Questions
Exam 8: The Business Cycle138 Questions
Exam 9: Aggregate Demand149 Questions
Exam 10: Self-Adjustment or Instability150 Questions
Exam 11: Fiscal Policy153 Questions
Exam 12: Deficits and Debt150 Questions
Exam 13: Money and Banks152 Questions
Exam 14: The Federal Reserve System147 Questions
Exam 15: Monetary Policy150 Questions
Exam 16: Supply-Side Policy: Short-Run Options146 Questions
Exam 17: Growth and Productivity: Long-Run Possibilities136 Questions
Exam 18: Theory Versus Reality150 Questions
Exam 19: International Trade152 Questions
Exam 20: International Finance151 Questions
Exam 21: Global Poverty152 Questions
Select questions type
Suppose a consumption function is given as C = $150 + 0.75YD.The marginal propensity to save is
(Multiple Choice)
4.8/5  (44)
(44)
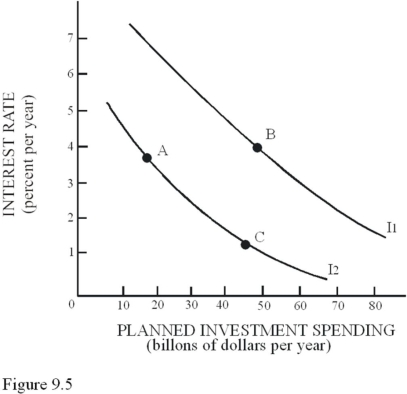 In Figure 9.5,a movement from Point A to Point B would result from
(Multiple Choice)
4.8/5 (35)
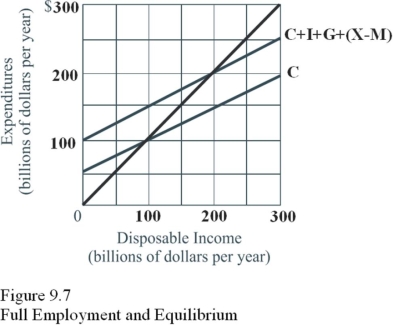 If the full-employment level of income in Figure 9.7 is $200 billion,there is
(Multiple Choice)
4.8/5 (40)
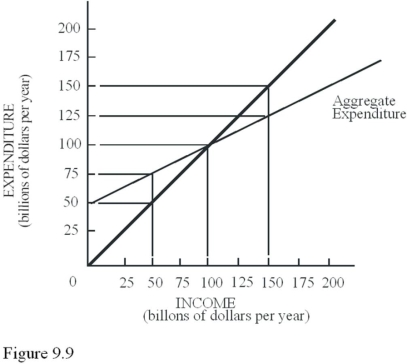 If the economy depicted in Figure 9.9 produced at a full-employment output level of $50 billion instead of the equilibrium output level,inventory levels would
(Multiple Choice)
4.9/5 (44)
Suppose a consumption function is given as C = $175 + 0.85YD.The marginal propensity to save is
(Multiple Choice)
4.8/5 (32)
Disposable Income (Billions of dollars per year) Total Consumption (Billions of dollars per year) \ 0 \ 50 200 210 Table 9.1 What is the rate of saving when income equals $1,000 billion in Table 9.1?
(Multiple Choice)
4.9/5 (37)
One In the News article titled,"News Release: Personal Income and Outlays" says that personal income increased $20 billion,or 0.17 percent,and consumers are likely to spend more if
(Multiple Choice)
4.9/5 (36)
Investment spending includes expenditures on all of the following except
(Multiple Choice)
4.9/5 (33)
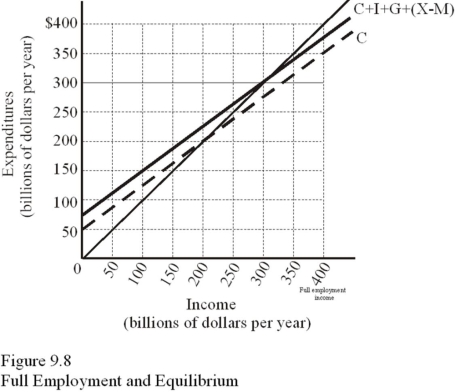 In Figure 9.8,if full-employment income is produced at $400 billion,we can expect inventories to
(Multiple Choice)
4.8/5 (35)
Filters
- Essay(0)
- Multiple Choice(0)
- Short Answer(0)
- True False(0)
- Matching(0)