Exam 11: Cost Behavior and Cost-Volume-Profit Analysis
Exam 1: The Role of Accounting in Business100 Questions
Exam 2: Basic Accounting Concepts91 Questions
Exam 3: Accrual Accounting Concepts115 Questions
Exam 4: Accounting for Merchandising Businesses145 Questions
Exam 5: Sarbanes-Oxley, internal Control, and Cash112 Questions
Exam 6: Receivables and Inventories105 Questions
Exam 7: Fixed Assets and Intangible Assets90 Questions
Exam 8: Liabilities and Stockholders Equity133 Questions
Exam 9: Financial Statement Analysis69 Questions
Exam 10: Accounting Systems for Manufacturing Businesses119 Questions
Exam 11: Cost Behavior and Cost-Volume-Profit Analysis140 Questions
Exam 12: Differential Analysis and Product Pricing102 Questions
Exam 13: Budgeting and Standard Cost Systems169 Questions
Exam 14: Performance Evaluation for Decentralized Operations137 Questions
Exam 15: Capital Investment Analysis103 Questions
Select questions type
Which of the following graphs illustrates the behavior of a total fixed cost within the specified relevant range? 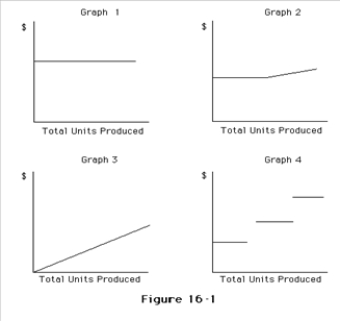
(Multiple Choice)
4.8/5  (38)
(38)
Foggy Co.has the following operating data for its manufacturing operations:
(Multiple Choice)
4.8/5 (37)
The point where the profit line intersects the left vertical axis on the profit-volume chart represents:
(Multiple Choice)
4.8/5 (39)
Given the following cost and activity observations for Alifix Company's utilities,use the highlow method to calculate Alifix's fixed costs per month.
(Multiple Choice)
4.8/5 (37)
If a business sells two products,it is not possible to estimate the break-even point.
(True/False)
4.7/5 (37)
Variable costs as a percentage of sales for Protoveo Inc.are 65%,sales are $500,000,and fixed costs are $125,000.How much would operating income change if sales decrease by $10,000?
(Multiple Choice)
4.8/5 (36)
If sales total $1,000,000,fixed costs total $200,000,and variable costs are 55% of the sales,the contribution margin ratio is 55%.
(True/False)
4.9/5 (28)
Fixed costs are costs that vary in total dollar amount as the level of activity changes.
(True/False)
4.8/5 (29)
Rouney Co.has budgeted that factory supervisors' salary will increase by 10%.If selling prices and all other cost relationships are held constant,next year's break-even point would:
(Multiple Choice)
4.8/5 (35)
Variable costs as a percentage of sales is equal to 100% minus the contribution margin ratio.
(True/False)
4.8/5 (38)
Lauder Company had fixed costs of $282,500,variable costs of $645,000,and actual sales amounted to $1,100,000.If the company has a break-even point at $750,000 in sales revenue,determine (a)the margin of safety expressed in dollars,(b)the margin of safety expressed as a percentage of sales,(c)the contribution margin ratio,and (d)the operating income.
(Essay)
4.8/5 (31)
Only a single line,which represents the difference between total sales revenues and total costs,is plotted on the cost-volume-profit chart.
(True/False)
4.9/5 (37)
Which of the following is true about the changes in fixed cost?
(Multiple Choice)
4.8/5 (43)
The ratio that indicates the percentage of each sales dollar available to cover the fixed costs and to provide operating income is termed as contribution margin ratio.
(True/False)
4.7/5 (37)
If a business sells four products,it is not possible to estimate the break-even point.
(True/False)
4.8/5 (38)
Currently,fixed costs are $540,000,the unit selling price is $95,and the unit variable cost is $60.What would be the break-even sales (in units),if the unit selling price is increased by $10?
(Multiple Choice)
4.8/5 (38)
Which of the following conditions would cause the break-even point to decrease?
(Multiple Choice)
4.9/5 (40)
The point where the profit line intersects the horizontal axis on the profit-volume chart represents:
(Multiple Choice)
4.8/5 (35)
Filters
- Essay(0)
- Multiple Choice(0)
- Short Answer(0)
- True False(0)
- Matching(0)