Exam 15: Monopoly and Antitrust Policy
Exam 1: Economics: Foundations and Models146 Questions
Exam 2: Trade-Offs, comparative Advantage, and the Market System153 Questions
Exam 3: Where Prices Come From: the Interaction of Demand and Supply147 Questions
Exam 4: Economic Efficiency, government Price Setting, and Taxes138 Questions
Exam 5: Externalities, environmental Policy, and Public Goods133 Questions
Exam 6: Elasticity: the Responsiveness of Demand and Supply150 Questions
Exam 7: The Economics of Health Care115 Questions
Exam 8: Firms, the Stock Market, and Corporate Governance141 Questions
Exam 9: Comparative Advantage and the Gains From International Trade123 Questions
Exam 10: Consumer Choice and Behavioral Economics154 Questions
Exam 11: Technology, production, and Costs165 Questions
Exam 12: Firms in Perfectly Competitive Markets151 Questions
Exam 13: Monopolistic Competition: the Competitive Model in a More Realistic Setting143 Questions
Exam 14: Oligopoly: Firms in Less Competitive Markets135 Questions
Exam 15: Monopoly and Antitrust Policy134 Questions
Exam 16: Pricing Strategy134 Questions
Exam 17: The Markets for Labor and Other Factors of Production147 Questions
Exam 18: Public Choice, taxes, and the Distribution of Income139 Questions
Select questions type
Arnold Harberger was the first economist to estimate the loss of economic efficiency due to market power.Since Harberger's findings were published,other researchers have studied this same issue.How do the results of these researchers compare to Harberger's results?
(Multiple Choice)
4.9/5  (36)
(36)
Figure 15-3 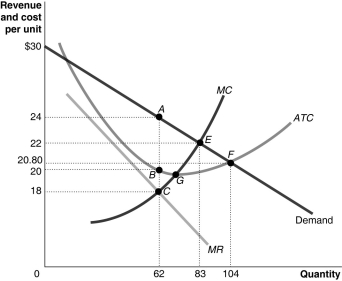 Figure 15-3 shows the cost and demand curves for a monopolist.
-Refer to Figure 15-3.The monopolist's total revenue is
Figure 15-3 shows the cost and demand curves for a monopolist.
-Refer to Figure 15-3.The monopolist's total revenue is
(Multiple Choice)
4.8/5 (37)
Network externalities refer to the situation where the usefulness of a product increases with the number of consumers who use it.
(True/False)
4.9/5 (39)
Explain whether a monopoly that maximizes profit will also be maximizing revenue and production.
(Essay)
4.9/5 (31)
Producers in perfect competition receive a smaller producer surplus than a monopoly producer.
(True/False)
4.9/5 (37)
When the government wants to give an exclusive right to one firm to produce a product,it
(Multiple Choice)
4.7/5 (29)
Merger guidelines developed by the Antitrust Division of the U.S.Department of Justice use four-firm concentration ratios as measures of concentration.
(True/False)
4.9/5 (41)
A natural monopoly is most likely to occur in which of the following industries?
(Multiple Choice)
4.7/5 (40)
Suppose a monopoly is producing its profit-maximizing output level.Now suppose the government imposes a lump-sum tax on the monopoly,independent of its output.As a result the monopolist will increase the price of its product to cover its higher cost.
(True/False)
4.8/5 (35)
Consider an industry that is made up of six firms with the following market shares: Firm A - 50%,Firm B - 20%,Firms C and D - 10% each,and Firms E and F - 5% each.What is the value of the Herfindahl-Hirschman Index and how will the industry be categorized?
(Multiple Choice)
4.8/5 (40)
Figure 15-5  Figure 15-5 shows the cost and demand curves for a monopolist.
-Refer to Figure 15-5.If the firm maximizes its profits,the deadweight loss to society due to this monopoly is equal to the area
Figure 15-5 shows the cost and demand curves for a monopolist.
-Refer to Figure 15-5.If the firm maximizes its profits,the deadweight loss to society due to this monopoly is equal to the area
(Multiple Choice)
4.9/5 (28)
Table 15-1
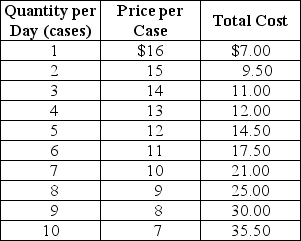 The government of a small developing country has granted exclusive rights to Linden Enterprises for the production of plastic syringes.Table 15-1 shows the cost and demand data for this government protected monopolist.
-Refer to Table 15-1.What is the amount of profit that the firm earns?
The government of a small developing country has granted exclusive rights to Linden Enterprises for the production of plastic syringes.Table 15-1 shows the cost and demand data for this government protected monopolist.
-Refer to Table 15-1.What is the amount of profit that the firm earns?
(Multiple Choice)
4.8/5 (36)
In evaluating the degree of economic efficiency in a market,we can state that the size of the deadweight loss in a market will be smaller
(Multiple Choice)
4.9/5 (33)
In the United States,government policies with respect to monopolies and collusion are embodied in
(Multiple Choice)
4.9/5 (39)
U.S.antitrust laws are designed to prohibit monopolization and encourage competition.Why,then,does the government erect barriers to entry and create monopoly power by granting firms patents?
(Essay)
4.8/5 (30)
The International Nickel Company of Canada is often cited as an example of monopoly,but International Nickel eventually lost its monopoly.What event was responsible for this?
(Multiple Choice)
4.9/5 (44)
If the OpenTable Website was a natural monopoly,dividing the business equally between two firms that each supplied the same number of online reservations would
(Multiple Choice)
4.8/5 (36)
Figure 15-7 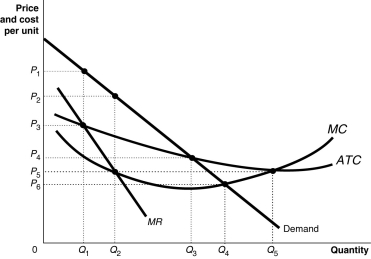 Figure 15-7 shows the market demand and cost curves facing a natural monopoly.
-Refer to figure 15-7.In the absence of any government regulation,the profit-maximizing owners of this firm will produce ________ units and charge a price of ________.
Figure 15-7 shows the market demand and cost curves facing a natural monopoly.
-Refer to figure 15-7.In the absence of any government regulation,the profit-maximizing owners of this firm will produce ________ units and charge a price of ________.
(Multiple Choice)
4.8/5 (31)
Figure 15-3 Figure 15-3 shows the cost and demand curves for a monopolist.
-Refer to Figure 15-3.The monopolist earns a profit of
(Multiple Choice)
4.7/5 (42)
Filters
- Essay(0)
- Multiple Choice(0)
- Short Answer(0)
- True False(0)
- Matching(0)