Exam 15: Time-Series Forecasting and Index Numbers
Exam 1: Introduction to Statistics79 Questions
Exam 2: Charts and Graphs75 Questions
Exam 3: Descriptive Statistics63 Questions
Exam 4: Probability72 Questions
Exam 5: Discrete Distributions80 Questions
Exam 6: Continuous Distributions78 Questions
Exam 7: Sampling and Sampling Distributions76 Questions
Exam 8: Statistical Inference: Estimation for Single Populations80 Questions
Exam 9: Statistical Inference: Hypothesis Testing for Single Populations79 Questions
Exam 10: Statistical Inferences About Two Populations70 Questions
Exam 11: Analysis of Variance and Design of Experiments80 Questions
Exam 12: Simple Regression Analysis and Correlation84 Questions
Exam 13: Multiple Regression Analysis80 Questions
Exam 14: Building Multiple Regression Models80 Questions
Exam 15: Time-Series Forecasting and Index Numbers77 Questions
Exam 16: Analysis of Categorical Data76 Questions
Exam 17: Nonparametric Statistics81 Questions
Exam 18: Statistical Quality Control68 Questions
Exam 19: Decision Analysis78 Questions
Select questions type
The following graph of time-series data suggests a ___ trend. 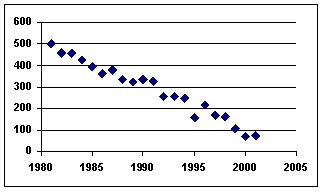
Free
(Multiple Choice)
4.8/5  (36)
(36)
Correct Answer: Verified
C
Autoregression is a multiple regression technique in which the independent variables are time-lagged versions of the dependent variable.
Free
(True/False)
4.8/5 (46)
Correct Answer:Verified
True
The forecast value for September was 10.6 and the actual value turned out to be 7.Using exponential smoothing with = 0.20,the forecast value for October would be ___.
Free
(Multiple Choice)
4.9/5 (48)
Correct Answer:Verified
B
The following graph of time-series data suggests a ___ trend. 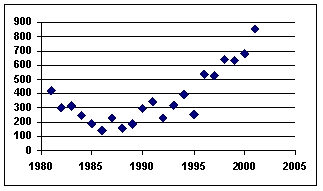
(Multiple Choice)
4.8/5 (29)
When a trucking firm uses the number of shipments for January of the previous year as the forecast for January next year,it is using a naïve forecasting model.
(True/False)
4.7/5 (42)
Using a three-month moving average,the forecast value for October made at the end of September in the following time series would be ___. 
(Multiple Choice)
4.8/5 (30)
A time series with forecast values and error terms is presented in the following table.The mean absolute deviation (MAD)for this forecast is ___. 
(Multiple Choice)
4.8/5 (40)
Using a three-month moving average,the forecast value for November in the following time series would be ___. 
(Multiple Choice)
4.8/5 (45)
Describe smoothing techniques for forecasting models,including naive,simple average,moving average,weighted moving average,and exponential smoothing.
(Essay)
4.7/5 (39)
The ratios of "actuals to moving averages" (seasonal indexes)for a time series are presented in the following table as percentages:  The initial estimate of the seasonal index for Q1 is ___.
(Multiple Choice)
4.8/5 (40)
Two popular general categories of smoothing techniques are averaging models and exponential models.
(True/False)
4.9/5 (44)
Autocorrelation in a regression forecasting model can be detected by the F test.
(True/False)
4.8/5 (39)
Jim Royo,manager of Billings Building Supply (BBS),wants to develop a model to forecast BBS's monthly sales (in $1,000's).He selects the dollar value of residential building permits (in $10,000)as the predictor variable.An analysis of the data yielded the following tables: 
 Jim's calculated value for the Durbin-Watson statistic is 1.93.Using = 0.05,the appropriate decision is: ___.
(Multiple Choice)
4.8/5 (44)
Linear regression models cannot be used to analyze quadratic trends in time-series data.
(True/False)
4.8/5 (47)
If autocorrelation occurs in regression analysis,then the confidence intervals and tests using the t and F distributions are no longer strictly applicable.
(True/False)
4.8/5 (44)
When the error terms of a regression forecasting model are correlated the problem of multicollinearity occurs.
(True/False)
5.0/5 (37)
Calculating the "ratios of actuals to moving average" is a common step in time series decomposition.The results (the quotients)of this step estimate the ___.
(Multiple Choice)
4.9/5 (28)
Filters
- Essay(6)
- Multiple Choice(51)
- Short Answer(0)
- True False(20)
- Matching(0)