Multiple Choice
The following graph of time-series data suggests a ___ trend. 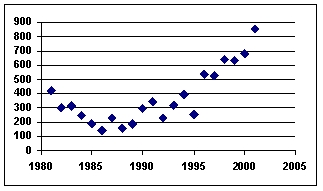
A) linear
B) quadratic
C) cosine
D) tangential
E) flat
Correct Answer:

Verified
Correct Answer:
Verified
Related Questions
Q1: The following graph of time-series data suggests
Q8: Using a three-month moving average,the forecast value
Q9: A time series with forecast values and
Q10: Using a three-month moving average,the forecast value
Q11: Describe smoothing techniques for forecasting models,including naive,simple
Q20: The forecast value for September was
Q24: When a trucking firm uses the number
Q44: Autoregression is a multiple regression technique in
Q67: The long-term general direction of data is
Q75: The motivation for using an index number