Exam 2: Applying Graphs to Economics
Exam 1: Thinking Like an Economist89 Questions
Exam 2: Applying Graphs to Economics37 Questions
Exam 3: Production Possibilities and Opportunity Cost122 Questions
Exam 4: Market Demand and Supply120 Questions
Exam 5: Markets in Action120 Questions
Exam 6: Elasticity of Demand and Supply118 Questions
Exam 7: Production Costs119 Questions
Exam 8: Perfect Competition124 Questions
Exam 9: Monopoly120 Questions
Exam 10: Monopolistic Competition and Oligopoly124 Questions
Exam 11: Policy Issues: Housing Affordability and Climate Change79 Questions
Exam 12: Measuring the Size of the Economy124 Questions
Exam 13: Business Cycles and Economic Growth120 Questions
Exam 14: Inflation and Unemployment116 Questions
Exam 15: A Simple Model of the Macro Economy134 Questions
Exam 16: The Monetary and Financial System123 Questions
Exam 17: Macroeconomic Policy I: Monetary Policy120 Questions
Exam 18: Macroeconomic Policy II: Fiscal Policy123 Questions
Exam 19: International Trade and Finance132 Questions
Select questions type
Narrbegin Exhibit A1.3 Straight line 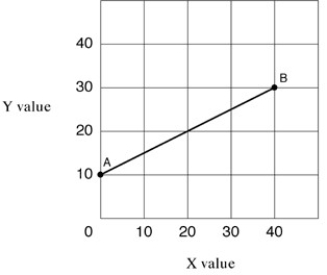 Narrend
-In Exhibit A1.3, the slope of straight line AB is:
Narrend
-In Exhibit A1.3, the slope of straight line AB is:
Free
(Multiple Choice)
4.8/5  (47)
(47)
Correct Answer: Verified
C
A horizontal line indicates an independent relationship between two variables.
Free
(True/False)
4.8/5 (42)
Correct Answer:Verified
True
Narrbegin Exhibit A1.5 Straight line 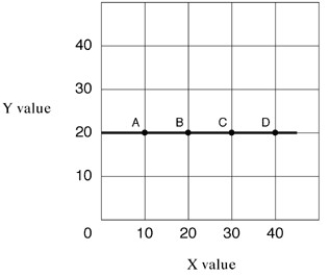 Narrend
-Straight line A-D in Exhibit A1.5 shows which of the following?
Narrend
-Straight line A-D in Exhibit A1.5 shows which of the following?
Free
(Multiple Choice)
4.8/5 (32)
Correct Answer:Verified
C
Narrbegin Exhibit A1.5 Straight line Narrend
-In Exhibit A1.5, the slope of straight line A-D is:
(Multiple Choice)
4.9/5 (40)
Measured between two points on a curve, the ratio of the change in the variable on the vertical axis to the change in the variable on the horizontal axis is the:
(Multiple Choice)
4.7/5 (42)
When one variable increases, the other variable increases - it is called:
(Multiple Choice)
4.7/5 (36)
Narrbegin Exhibit A1.3 Straight line Narrend
-As shown in Exhibit A1.3, the intercept of straight line AB is:
(Multiple Choice)
4.8/5 (29)
Narrbegin Exhibit A1.4 Straight line 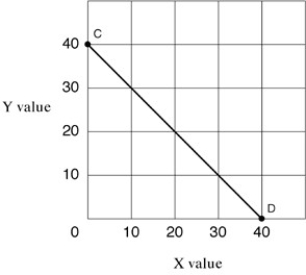 Narrend
-In Exhibit A1.4, the slope of straight line CD is:
Narrend
-In Exhibit A1.4, the slope of straight line CD is:
(Multiple Choice)
4.9/5 (41)
Narrbegin Exhibit A1.2 Straight line 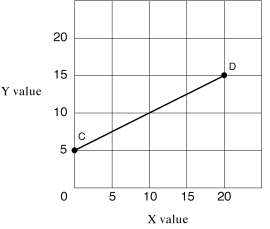 Narrend
-In Exhibit A1.2, as X increases along the horizontal axis, corresponding to points C-D on the line, the Y values decrease. The relationship between the X and Y variables is:
Narrend
-In Exhibit A1.2, as X increases along the horizontal axis, corresponding to points C-D on the line, the Y values decrease. The relationship between the X and Y variables is:
(Multiple Choice)
4.8/5 (30)
If the coordinates are x1=3, y1=6 and x2=1, y2=2, the slope of the line is:
(Multiple Choice)
4.7/5 (50)
Narrbegin Exhibit A1.5 Straight line Narrend
-In Exhibit A1.5, as X increases along the horizontal axis, corresponding to points A-D on the line, the Y values remain unchanged at 20 units. The relationship between the X and Y variables is:
(Multiple Choice)
4.7/5 (43)
Narrbegin Exhibit A1.2 Straight line Narrend
-Straight line CD in Exhibit A1.2 shows which of the following?
(Multiple Choice)
4.9/5 (35)
Which of the following pairs is the most likely to exhibit an inverse relationship?
(Multiple Choice)
4.9/5 (43)
Narrbegin Exhibit A1.6 Straight-line relationship 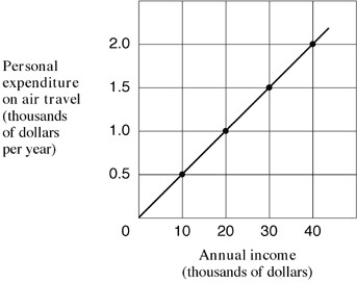 Narrend
-Which of the following would cause a shift in the relationship shown in Exhibit A1.6?
Narrend
-Which of the following would cause a shift in the relationship shown in Exhibit A1.6?
(Multiple Choice)
4.8/5 (42)
Narrbegin Exhibit A1.1 Straight line 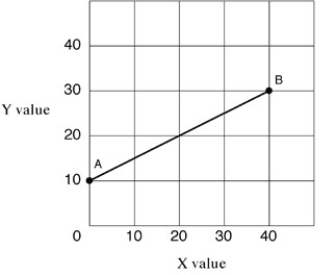 Narrend
-In Exhibit A1.1, as X increases along the horizontal axis, corresponding to points A-B on the line, the Y values increase. The relationship between the X and Y variables is:
Narrend
-In Exhibit A1.1, as X increases along the horizontal axis, corresponding to points A-B on the line, the Y values increase. The relationship between the X and Y variables is:
(Multiple Choice)
4.7/5 (38)
Narrbegin Exhibit A1.3 Straight line Narrend
-As shown in Exhibit A1.3, the slope of straight line AB:
(Multiple Choice)
4.8/5 (41)
A direct relationship is a relationship between two variables in which they move in different directions (if one increases, the other decreases).
(True/False)
4.8/5 (37)
Filters
- Essay(0)
- Multiple Choice(0)
- Short Answer(0)
- True False(0)
- Matching(0)