Exam 9: Aggregate Demand and Supply
Exam 1: Exploring Economics286 Questions
Exam 2: Production, Economic Growth, and Trade303 Questions
Exam 3: Supply and Demand310 Questions
Exam 4: Markets and Government317 Questions
Exam 5: Introduction to Macroeconomics274 Questions
Exam 6: Measuring Inflation and Unemployment253 Questions
Exam 7: Economic Growth269 Questions
Exam 8: Aggregate Expenditures253 Questions
Exam 9: Aggregate Demand and Supply265 Questions
Exam 10: Fiscal Policy and Debt362 Questions
Exam 11: Saving, Investment, and the Financial System278 Questions
Exam 12: Money Creation and the Federal Reserve236 Questions
Exam 13: Monetary Policy298 Questions
Exam 14: Macroeconomic Policy: Challenges in a Global Economy266 Questions
Exam 15: International Trade243 Questions
Exam 16: Open Economy Macroeconomic249 Questions
Select questions type
An increase in taxes shifts the aggregate demand curve to the left.
(True/False)
4.8/5  (34)
(34)
When the price of a given product declines,the consumer's spendable income rises because it takes less income to purchase the same quantity.This is called the:
(Multiple Choice)
4.8/5 (38)
According to Keynes,what determines the level of employment and income?
(Multiple Choice)
4.9/5 (35)
Which of the following factors will cause the aggregate demand curve to shift to the right?
(Multiple Choice)
4.8/5 (42)
The multiplier is calculated by using the formula 1 divided by the marginal propensity to save.
(True/False)
4.9/5 (40)
Use the following to answer questions
Figure: Determining SRAS Shifts 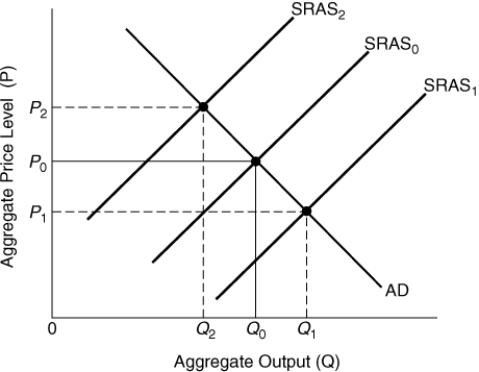 -(Figure: Determining SRAS Shifts)If there is a decrease in input prices,the short-run aggregate supply curve will shift from SRAS0 to _____ and the price level will become _____.
(Multiple Choice)
4.9/5 (40)
Suppose when John's income increased from $10,000 to $15,000,his consumption increased from $3,000 to $4,500.What is the value of his marginal propensity to save?
(Multiple Choice)
4.9/5 (29)
If the pound sterling appreciates against the U.S.dollar,England buys ______ U.S.goods,causing the U.S.aggregate demand curve to shift to the ______.
(Multiple Choice)
4.9/5 (32)
Which of the following would NOT cause a shift in the aggregate demand curve?
(Multiple Choice)
4.9/5 (38)
(Figure: Understanding Aggregate Graphs 2) 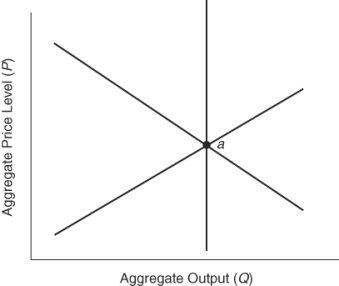 This economy is at point a.This figure depicts an economy:
(Multiple Choice)
5.0/5 (41)
If Europe has a large increase in income,what will happen in the United States?
(Multiple Choice)
4.9/5 (38)
At high domestic price levels compared to other countries,Americans:
(Multiple Choice)
4.9/5 (44)
If the marginal propensity to consume is 0.5,then $50 of every additional $100 of income will be spent.
(True/False)
4.8/5 (34)
If an economy is in long-run equilibrium,it is also in short-run equilibrium.
(True/False)
4.7/5 (38)
Define the spending multiplier and describe why it is important.Provide an example and formulas to describe how to calculate the multiplier at a stable price level.
(Essay)
4.7/5 (32)
The aggregate supply curve shows that the price level and real GDP are indirectly related.
(True/False)
4.9/5 (35)
Output definitely increases if aggregate demand ______ and aggregate supply ______.
(Multiple Choice)
4.8/5 (33)
Filters
- Essay(0)
- Multiple Choice(0)
- Short Answer(0)
- True False(0)
- Matching(0)