Exam 10: Aggregate Demand I
Exam 1: The Science of Macroeconomics54 Questions
Exam 2: The Data of Macroeconomics116 Questions
Exam 5: The Open Economy124 Questions
Exam 6: Unemployment112 Questions
Exam 7: Economic Growth I114 Questions
Exam 8: Economic Growth II94 Questions
Exam 9: Introduction to Economic Fluctuations106 Questions
Exam 10: Aggregate Demand I142 Questions
Exam 13: Aggregate Supply and the Short-Run112 Questions
Exam 15: Stabilization Policy98 Questions
Exam 16: Government Debt and Budget Deficits91 Questions
Exam 18: Investment103 Questions
Exam 19: Money Supply and Money Demand102 Questions
Exam 20: The Financial System108 Questions
Select questions type
a.Graphically illustrate how an increase in income affects the equilibrium levels of saving,investment,and the interest rate in the loanable funds model.Be sure to label:
i.the axes
ii.the curves
iii.the initial equilibrium values
iv.the direction the curve shifts to
v.the terminal equilibrium values.b.Explain in words what happens to the equilibrium levels of saving,investment,and the interest rates as a result of the increase in income.
Free
(Essay)
4.9/5  (39)
(39)
Correct Answer: Verified
a.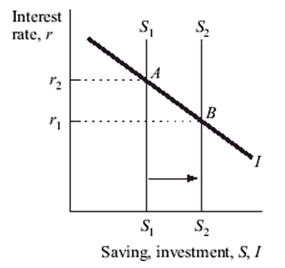
b. The equilibrium levels of saving and investment increase.The interest rate falls.
Explain why an increase in the money supply,which is a change in the money market,will upset the equilibrium in the goods market.
Free
(Essay)
4.8/5 (32)
Correct Answer:Verified
An increase in the money supply will decrease the equilibrium interest rate in the money market.A lower interest rate will increase investment spending in the goods market,which will increase the equilibrium level of income in the goods market.Graphically,this is represented by a shift in the LM curve to the right and a movement down the IS curve.
According to the theory of liquidity preference,if the supply of real money balances exceeds the demand for real money balances,individuals will:
Free
(Multiple Choice)
4.9/5 (33)
Correct Answer:Verified
B
Use the following to answer questions :
Exhibit: Market for Real Money Balances
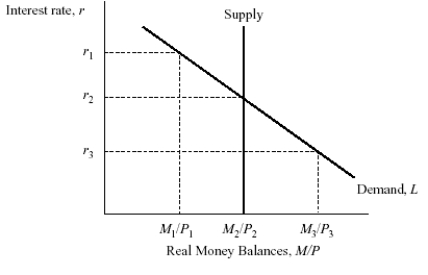 -(Exhibit: Market for Real Money Balances)Based on the graph,the equilibrium levels of interest rates and real money balances are:
(Multiple Choice)
4.8/5 (27)
All of the following items shrink the expenditure multiplier in the Keynesian-cross model except:
(Multiple Choice)
4.9/5 (44)
According to the Keynesian-cross analysis,if MPC stands for marginal propensity to consume,then a rise in taxes of T will:
(Multiple Choice)
4.9/5 (31)
a.Use the Keynesian-cross model to illustrate graphically the impact of an increase in the interest rate on the equilibrium level of income.Be sure to label:
i.the axes
ii.the curves
iii.the initial equilibrium values
iv.the direction the curve shifts
v.the terminal equilibrium values.b.Explain in words what happens to equilibrium income as a result of the increase in the interest rate.
(Essay)
4.8/5 (42)
The variable that links the market for goods and services and the market for real money balances in the IS-LM model is the:
(Multiple Choice)
4.9/5 (29)
According to the theory of liquidity preference,the supply of nominal money balances:
(Multiple Choice)
4.8/5 (37)
Equilibrium levels of income and interest rates are ______ related in the goods and services market,and equilibrium levels of income and interest rates are ______ related in the market for real money balances.
(Multiple Choice)
4.8/5 (34)
Suppose the government passes legislation that significantly reduces taxes.a.Use the Keynesian-cross model to illustrate graphically the impact of a reduction in taxes on the equilibrium level of income.Be sure to label:
i.the axes
ii.the curves
iii.the initial equilibrium values
iv.the direction the curve shifts
v.the terminal equilibrium values.b.Explain in words what happens to equilibrium income as a result of the tax cut and the time horizon appropriate for this analysis.
(Essay)
4.9/5 (27)
Compare how equilibrium is attained in the market for goods and services versus the market for real-money balances. (Hint: Explain what force moves the market back to equilibrium if the market is initially in disequilibrium.)
(Essay)
4.9/5 (32)
If money demand does not depend on the interest rate,then the LM curve is ______ and ______ policy has no effect on output.
(Multiple Choice)
5.0/5 (32)
The IS curve provides combinations of interest rates and income that satisfy equilibrium in the market for ______,and the LM curve provides combinations of interest rates and income that satisfy equilibrium in the market for ______.
(Multiple Choice)
4.8/5 (38)
Consider the impact of an increase in thriftiness in the Keynesian-cross analysis.Assume that the marginal propensity to consume is unchanged,but the intercept of the consumption function is made smaller so that at every income level saving is greater.This will:
(Multiple Choice)
4.9/5 (34)
An interpretation of why the IS curve slopes downward and to the right is that as income rises,national saving rises,and this increase drives the interest rate:
(Multiple Choice)
4.7/5 (38)
Filters
- Essay(0)
- Multiple Choice(0)
- Short Answer(0)
- True False(0)
- Matching(0)