Exam 4: Using Supply and Demand
Exam 1: The Role and Method of Economics235 Questions
Exam 2: The Economic Way of Thinking152 Questions
Exam 3: Supply and Demand252 Questions
Exam 4: Using Supply and Demand248 Questions
Exam 5: Market Failure and Public Choice206 Questions
Exam 6: Production and Costs177 Questions
Exam 7: Firms in Competitive Markets200 Questions
Exam 8: Monopoly162 Questions
Exam 9: Monopolistic Competition and Oligopoly193 Questions
Exam 10: Labor Markets, Income Distribution, and Poverty230 Questions
Exam 11: Introduction to Macroeconomics: Unemployment, Inflation, and Economic Fluctuations151 Questions
Exam 12: Economic Growth177 Questions
Exam 13: Aggregate Demand and Aggregate Supply180 Questions
Exam 14: Fiscal Policy123 Questions
Exam 15: Monetary Institutions170 Questions
Exam 16: The Federal Reserve System and Monetary Policy133 Questions
Exam 17: Issues in Macroeconomic Theory and Policy105 Questions
Exam 18: International Economics261 Questions
Select questions type
Figure 4-A
The diagram below represents the market for butter. 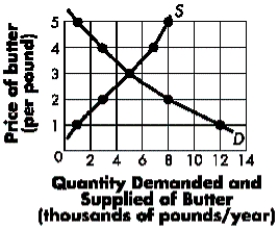 -Refer to Figure 4-A.If a price ceiling of $4 is imposed, we would expect that ____ units of butter will be sold.
(Multiple Choice)
4.9/5  (38)
(38)
The area between the market price and the supply curve provides a measure of:
(Multiple Choice)
4.9/5 (37)
Based on the graph below, what is the consumer surplus of the 10th unit bought/sold? 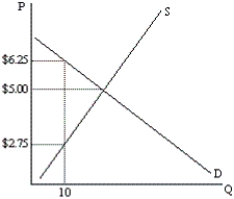
(Multiple Choice)
4.8/5 (38)
Table 4-D
Miles demands jazz CDs according to the following demand schedule:
Price af jazz CDs Qurantity of jazz CDs \ 30 1 \ 25 2 \ 20 3 \ 15 4 \ 10 5
-Refer to Table 4-D.If the price of jazz CDs equals $20, the consumer surplus Miles receives from purchasing jazz CDs is:
(Multiple Choice)
4.8/5 (37)
Exhibit 4-A 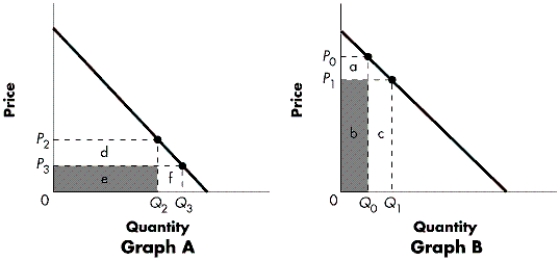 -Refer to Exhibit 4-A.Elasticity varies along a linear demand curve.Graph B represents the section of the curve where:
(Multiple Choice)
4.8/5 (41)
Which of the following is not likely to result from an increase in the federal minimum wage?
(Multiple Choice)
4.9/5 (32)
Exhibit 4-C 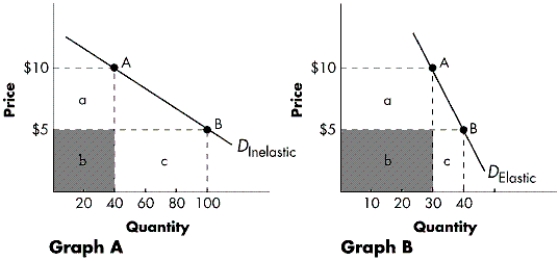 -Refer to Exhibit 4-C.Graph B represents a demand curve that is relatively ____.Total revenue ____ as the price decreases from $10 to $5.
(Multiple Choice)
4.8/5 (38)
To the extent that a governmental price control succeeds in affecting price, it can be expected to lead to a corresponding:
(Multiple Choice)
4.8/5 (41)
If a good has a perfectly inelastic short-run supply curve, an increase in demand will:
(Multiple Choice)
4.8/5 (43)
Whenever a price ceiling is imposed in a market, it is true that:
(Multiple Choice)
4.7/5 (38)
If the demand is perfectly elastic, what would happen to the quantity demanded if there is a tiny increase in price?
(Multiple Choice)
4.9/5 (32)
If the measured elasticity of supply coefficient equals 0.6, then supply is:
(Multiple Choice)
4.9/5 (48)
A tax is imposed on orange juice.Consumers will bear the full burden of this tax if the:
(Multiple Choice)
4.8/5 (35)
If the supply curve is perfectly elastic, then an increase in demand will:
(Multiple Choice)
4.8/5 (42)
Figure 4-C 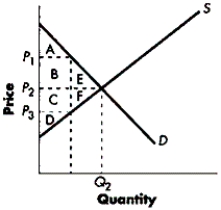 -Refer to Figure 4-C.If the market price equals P2, producer surplus can be identified in the diagram as area:
(Multiple Choice)
4.9/5 (43)
Figure 4-D 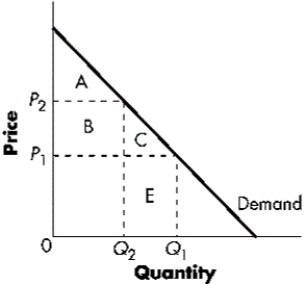 -Refer to Figure 4-D.When the price is P1, the consumer surplus is equal to the area:
(Multiple Choice)
4.8/5 (39)
Filters
- Essay(0)
- Multiple Choice(0)
- Short Answer(0)
- True False(0)
- Matching(0)