Exam 1: The Scope and Method of Economics
Exam 1: The Scope and Method of Economics120 Questions
Exam 2: The Economic Problem: Scarcity and Choice110 Questions
Exam 3: Demand,supply,and Market Equilibrium144 Questions
Exam 4: Demand and Supply Applications86 Questions
Exam 5: Introduction to Macroeconomics121 Questions
Exam 6: Measuring National Output and National Income146 Questions
Exam 7: Unemployment,inflation,and Long-Run Growth149 Questions
Exam 8: Aggregate Expenditure and Equilibrium Output176 Questions
Exam 9: The Government and Fiscal Policy169 Questions
Exam 10: The Money Supply and the Federal Reserve System144 Questions
Exam 11: Money Demand and the Equilibrium Interest Rate129 Questions
Exam 12: The Determination of Aggregate Output, the Price Level, and the Interest Rate119 Questions
Exam 13: Policy Effects and Costs Shocks in the Asad Model102 Questions
Exam 14: The Labor Market in the Macroeconomy147 Questions
Exam 15: Financial Crises, stabilization, and Deficits129 Questions
Exam 16: Household and Firm Behavior in the Macroeconomy: a Further Look185 Questions
Exam 17: Long-Run Growth93 Questions
Exam 18: Alternative Views in Macroeconomics147 Questions
Exam 19: International Trade, comparative Advantage, and Protectionism151 Questions
Exam 20: Open-Economy Macroeconomics: the Balance of Payments and Exchange Rates160 Questions
Exam 21: Economic Growth in Developing and Transitional Economies105 Questions
Select questions type
Refer to Scenario 1.1 below to answer the questions that follow.
SCENARIO 1.1: An economist wants to understand the relationship between minimum wages and the level of teenage unemployment.The economist collects data on the values of the minimum wage and the levels of teenage unemployment over time.The economist concludes that a 1% increase in minimum wage causes a 0.2% increase in teenage unemployment.From this information he concludes that the minimum wage is harmful to teenagers and should be reduced or eliminated to increase employment among teenagers.
-Refer to Scenario 1.1.The statement that an increase in the minimum wage causes an increase in teenage unemployment is an example of
(Multiple Choice)
4.9/5  (44)
(44)
Experimental research in small cities suggests that mandating work for welfare recipients increases their income.Therefore,we should mandate work requirements for all welfare recipients.This statement is an example of
(Multiple Choice)
4.9/5 (46)
Suppose that you purchased a ticket to a jazz festival for $100 from an online ticket broker.Once you arrived at the festival,you discovered that parking costs you an additional $15.In this situation,the additional $15 you pay for parking is an example of
(Multiple Choice)
4.9/5 (38)
Which of the following is NOT one of the three fundamental concepts of economics?
(Multiple Choice)
4.8/5 (38)
Refer to the information provided in Figure 1.5 below to answer the questions that follow.
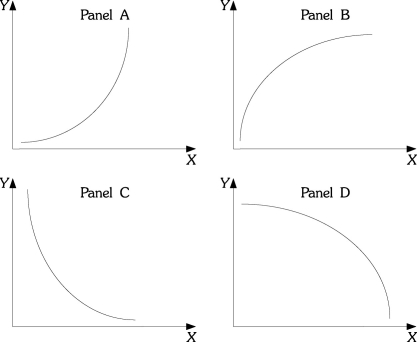 Figure 1.5
-Refer to Figure 1.5.In many industries,as firms produce additional units,average costs of production decline as the firm produces an additional unit,but average costs declines by a smaller and smaller amount as production continues to increase.If output is graphed on the horizontal axis and average costs are graphed on the vertical axis,the relationship between average costs and output would be like which of the following panels?
Figure 1.5
-Refer to Figure 1.5.In many industries,as firms produce additional units,average costs of production decline as the firm produces an additional unit,but average costs declines by a smaller and smaller amount as production continues to increase.If output is graphed on the horizontal axis and average costs are graphed on the vertical axis,the relationship between average costs and output would be like which of the following panels?
(Multiple Choice)
4.8/5 (38)
Redistribution of income from the rich to the poor is achieved from a tax system that requires taxes to rise with income.Which of the following criteria best explains the goal of this tax system?
(Multiple Choice)
4.8/5 (42)
An efficient economy is one that produces what consumers demand and does so at the least possible cost.
(True/False)
4.8/5 (33)
Refer to the information provided in Figure 1.3 below to answer the questions that follow.
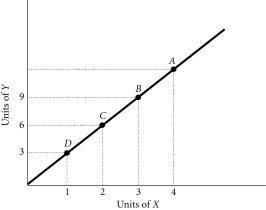 Figure 1.3
-Refer to Figure 1.3.The slope of the line is
Figure 1.3
-Refer to Figure 1.3.The slope of the line is
(Multiple Choice)
4.7/5 (29)
Refer to the information provided in Figure 1.4 below to answer the questions that follow.
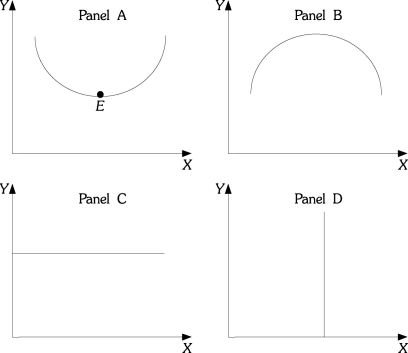 Figure 1.4
-Refer to Figure 1.4.Which of the following curves or lines has a zero slope throughout?
Figure 1.4
-Refer to Figure 1.4.Which of the following curves or lines has a zero slope throughout?
(Multiple Choice)
4.9/5 (32)
Refer to the information provided in Figure 1.4 below to answer the questions that follow.
Figure 1.4
-Refer to Figure 1.4.Which of the curves or lines has an infinite slope throughout?
(Multiple Choice)
4.8/5 (38)
Related to the Economics in Practice on p.10: Prior to joining a fraternity,James spent most of his evenings and weekends studying for his classes.Once he joined the fraternity,James spent a majority of his evenings and weekends going to parties.This change in behavior is best described by
(Multiple Choice)
4.7/5 (33)
A government policy that tries to minimize inflation and unemployment can best be described as trying to achieve economic
(Multiple Choice)
4.8/5 (33)
Refer to the information provided in Figure 1.4 below to answer the questions that follow.
Figure 1.4
-Refer to Figure 1.4.At Point E in panel A,the slope is
(Multiple Choice)
4.8/5 (35)
Refer to the information provided in Figure 1.3 below to answer the questions that follow.
Figure 1.3
-Refer to Figure 1.3.At Point A the slope of the line is 3,so at Point D the slope would be
(Multiple Choice)
4.7/5 (33)
You have noticed that there is an increase in the number of homeless people in your city.At the same time you observe that there are also a number of vacant apartments.You believe that the government could reduce the number of homeless people if landlords were required to rent their apartments for less than they are currently charging.This policy recommendation would be motivated by concerns over
(Multiple Choice)
4.8/5 (42)
The rise of the modern factory system in England during the late eighteenth and early nineteenth centuries is known as the
(Multiple Choice)
4.8/5 (44)
Refer to the information provided in Figure 1.5 below to answer the questions that follow.
Figure 1.5
-Refer to Figure 1.5.Which of the curves has a slope that is positive and decreasing?
(Multiple Choice)
4.8/5 (40)
The cost involved when choosing between alternatives is known as the
(Multiple Choice)
4.7/5 (35)
Filters
- Essay(0)
- Multiple Choice(0)
- Short Answer(0)
- True False(0)
- Matching(0)