Exam 15: Aggregate Demand and Aggregate Supply Analysis
Exam 1: Economics: Foundations and Models145 Questions
Exam 2: Trade-Offs, comparative Advantage, and the Market System151 Questions
Exam 3: Where Prices Come From: the Interaction of Demand and Supply149 Questions
Exam 4: Market Efficiency and Market Failure171 Questions
Exam 5: The Economics of Health Care117 Questions
Exam 6: Firms, the Stock Market, and Corporate Governance126 Questions
Exam 7: Consumer Choice and Elasticity193 Questions
Exam 8: Technology,production,and Costs147 Questions
Exam 9: Firms in Perfectly Competitive Markets153 Questions
Exam 10: Monopoly and Antitrust Policy148 Questions
Exam 11: Monopolistic Competition and Oligopoly200 Questions
Exam 12: GDP: Measuring Total Production and Income135 Questions
Exam 13: Unemployment and Inflation148 Questions
Exam 14: Economic Growth, the Financial System, and Business Cycles130 Questions
Exam 15: Aggregate Demand and Aggregate Supply Analysis145 Questions
Exam 16: Money, banks, and the Federal Reserve System144 Questions
Exam 17: Monetary Policy145 Questions
Exam 18: Fiscal Policy143 Questions
Exam 19: Comparative Advantage,international Trade,and Exchange Rates158 Questions
Select questions type
Full-employment GDP is also known as
Free
(Multiple Choice)
4.8/5  (33)
(33)
Correct Answer: Verified
B
An increase in the price level will
Free
(Multiple Choice)
4.8/5 (40)
Correct Answer:Verified
C
An increase in the price level results in a(n)________ in the quantity of real GDP demanded because ________.
Free
(Multiple Choice)
4.9/5 (40)
Correct Answer:Verified
A
Using an aggregate demand graph,illustrate the impact of an increase in the interest rate.
(Essay)
4.9/5 (33)
The ________ shows the relationship between the price level and quantity of real GDP demanded.
(Multiple Choice)
4.9/5 (35)
At a short-run macroeconomic equilibrium,real GDP is always equal to potential GDP.
(True/False)
4.9/5 (40)
Monetarists believe that the quantity of money should be increased at an increasing rate.
(True/False)
4.8/5 (45)
FedEx plays such a large role in moving packages around the country that there is usually a close relationship between fluctuations in FedEx's business and fluctuations in GDP.Some economists refer to this relationship as the
(Multiple Choice)
4.9/5 (43)
Figure 15-1 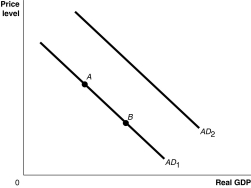 -Refer to Figure 15-1.Ceteris paribus,an increase in households' expectations of their future income would be represented by a movement from
(Multiple Choice)
4.9/5 (30)
At the beginning of the recession of 2007-2009,real GDP in the United States was ________ potential GDP,and in June 2009,real GDP was ________ potential GDP.
(Multiple Choice)
4.8/5 (34)
Figure 15-3 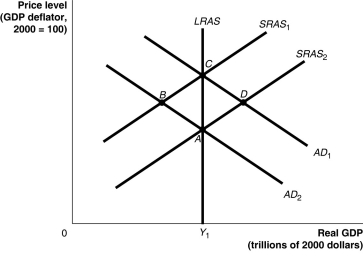 -Refer to Figure 15-3.Which of the points in the above graph are possible short-run equilibria but not long-run equilibria? Assume that Y1 represents potential GDP.
(Multiple Choice)
4.9/5 (38)
Which of the following is one reason for the decline in aggregate demand that led to the recession of 2007-2009?
(Multiple Choice)
4.9/5 (36)
Why does the short-run aggregate supply curve shift to the right in the long run,following a decrease in aggregate demand?
(Multiple Choice)
4.9/5 (33)
Figure 15-2 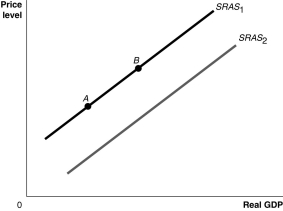 -Refer to Figure 15-2.Ceteris paribus,a decrease in the capital stock would be represented by a movement from
(Multiple Choice)
4.8/5 (36)
A supply shock causes the long-run aggregate supply curve to shift left,decreasing the price level.
(True/False)
4.7/5 (44)
Figure 15-3
-Refer to Figure 15-3.Suppose the economy is at point A.If the economy experiences a supply shock,where will the eventual short-run equilibrium be?
(Multiple Choice)
4.8/5 (38)
When the price level rises from 110 to 115,the aggregate level of GDP supplied rises from $80 billion to $120 billion.This ________ relationship represents the ________ relationship between the quantity of real GDP firms are willing to supply and the price level.
(Multiple Choice)
4.7/5 (34)
Filters
- Essay(0)
- Multiple Choice(0)
- Short Answer(0)
- True False(0)
- Matching(0)