Exam 17: New Classical Macro Confronts New Keynesian Macro
Exam 1: What Is Macroeconomics71 Questions
Exam 2: The Measurement of Income, Prices, and Unemployment84 Questions
Exam 3: Spending, Income, and Interest Rates166 Questions
Exam 4: Monetary and Fiscal Policy in the Is-Lm Model147 Questions
Exam 5: The Government Budget, Foreign Borrowing, and the Twin Deficits79 Questions
Exam 6: International Trade, Exchange Rates, and Macroeconomic Policy149 Questions
Exam 7: Aggregate Demand, Aggregate Supply, and the Self-Correcting Economy153 Questions
Exam 8: Inflation: Its Causes and Cures189 Questions
Exam 9: The Goals of Stabilization Policy: Low Inflation and Low Unemployment132 Questions
Exam 10: The Theory of Economic Growth113 Questions
Exam 11: The Big Questions of Economic Growth74 Questions
Exam 12: The Government Budget, the Public Debt, and Social Security106 Questions
Exam 13: Money and Financial Markets152 Questions
Exam 14: Stabilization Policy in the Closed and Open Economy135 Questions
Exam 15: The Economics of Consumption Behavior102 Questions
Exam 16: The Economics of Investment Behavior110 Questions
Exam 17: New Classical Macro Confronts New Keynesian Macro170 Questions
Exam 18: Conclusion: Where We Stand28 Questions
Select questions type
Suppose a worker signs a contract containing an 8 percent nominal wage increase with inflation expected to be 3 percent. Inflation turns out to be 6 percent, but the contract also contains 60 percent COLA protection. The worker's real wage under the contract
(Multiple Choice)
4.8/5  (30)
(30)
What all "New Classical" models have in common is the assumption of
(Multiple Choice)
4.8/5 (41)
In the RBC model, the importance of "intertemporal substitution" of labor supply is ________, which results in a rather ________ labor supply curve.
(Multiple Choice)
4.9/5 (38)
The more that firms in an economy believe that the demand for their goods is mainly influenced by the aggregate level of demand and not "local conditions," the ________ is the SAS curve and thus the ________ are cycles in real GDP.
(Multiple Choice)
4.8/5 (33)
A principle difference between the new Classical and the new Keynesian models has to do with the choices made by business firms. We find that
(Multiple Choice)
5.0/5 (36)
According to the Real Business Cycle model real wages should
(Multiple Choice)
4.8/5 (44)
According to Gordon which of the following statements about Friedman's fooling model is accurate?
(Multiple Choice)
4.8/5 (37)
In Figure 17-4, below, initial demand, marginal cost, and marginal revenue curves (none of them shown) caused the firm to produce the profit-maximizing quantity Y0 at a price of P0. Now the demand and marginal cost curves have moved to those shown, with the marginal revenue curve running through point L.
Figure 17-4 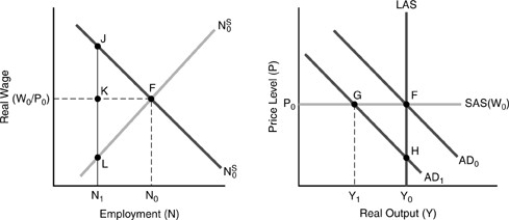 -In the figure above, the profit-maximizing quantity, in the absence of "menu costs," ________, with profit equal to ________.
(Multiple Choice)
4.9/5 (33)
According to the new Keynesian economists, SAS adjusts slowly to a change in AD because of
(Multiple Choice)
4.9/5 (37)
If the labor supply curve is upward-sloping, an adverse supply shock causes ________ in employment and ________ in the real wage.
(Multiple Choice)
4.8/5 (43)
Aggregate price information, such as recalculations of the CPI, is available to the public with ________ lags, causing difficulty for the ________ of the New Classical approach.
(Multiple Choice)
4.7/5 (42)
Which of the following is not a reason why natural GDP might fall as a result of a supply shock?
(Multiple Choice)
4.8/5 (39)
Initially a firm pays a wage and gets an output per worker which are given index numbers of 1.00. Five possible 3 percent increases in the wage and the accompanying output per worker are as follows: 1.03 and 1.09, 1.06 and 1.17, 1.09 and 1.24, 1.13 and 1.29, 1.16 and 1.31. What is the efficiency wage?
(Multiple Choice)
4.8/5 (39)
Under the assumptions of the new Keynesian model, an increase in aggregate demand will
(Multiple Choice)
4.8/5 (33)
In the RBC model, an adverse supply shock causes the decrease in natural real GDP to be minimized when the labor supply curve is
(Multiple Choice)
4.9/5 (38)
Gordon believes that the new Keynesian approach as opposed to other business cycle theories is preferred because
(Multiple Choice)
5.0/5 (34)
Figure 17-3 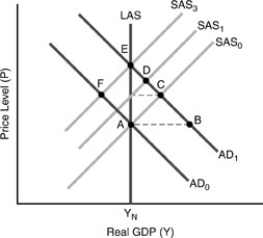 -In the figure above, suppose we are working under assumptions of the Lucas model. With an expansionary monetary policy, the "policy ineffectiveness proposition" is shown as a movement between points
(Multiple Choice)
4.9/5 (33)
Filters
- Essay(0)
- Multiple Choice(0)
- Short Answer(0)
- True False(0)
- Matching(0)