Deck 4: Forecasting
Full screen (f)
Question
Question
Question
Question
Question
Question
Question
Question
Question
Question
Question
Question
Question
Question
Question
Question
Question
Question
Question
Question
Question
Question
Question
Question
Question
Question
Question
Question
Question
Question
Question
Question
Question
Question
Question
Question
Question
Question
Question
Question
Question
Question
What is the approximate forecast for May using a four-month moving average? 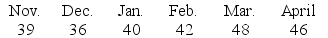
A) 38
B) 42
C) 43
D) 44
E) 47
A) 38
B) 42
C) 43
D) 44
E) 47
Question
Question
Question
Question
Question
A forecasting method has produced the following over the past five months. What is the mean absolute deviation? 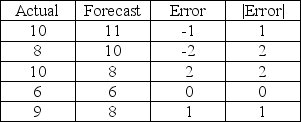
A) -0.2
B) -1.0
C) 0.0
D) 1.2
E) 8.6
A) -0.2
B) -1.0
C) 0.0
D) 1.2
E) 8.6
Question
Question
Question
Question
Question
Question
Question
Question
Question
Question
Question
Question
Question
Question
Question
Question
Question
Question
Question
Question
Question
Question
Question
Question
Question
Question
Question
Question
Question
Question
Question
Question
Question

Unlock Deck
Sign up to unlock the cards in this deck!
Unlock Deck
Unlock Deck
1/142
Play
Full screen (f)
Deck 4: Forecasting
1
Mean Squared Error and Coefficient of Correlation are two measures of the overall error of a forecasting model.
False
2
The sales force composite forecasting method relies on salespersons' estimates of expected sales.
True
3
The forecasting time horizon and the forecasting techniques used tend to vary over the life cycle of a product.
True
4
A trend projection equation with a slope of 0.78 means that there is a 0.78 unit rise in Y for every unit of time that passes.
Unlock Deck
Unlock for access to all 142 flashcards in this deck.
Unlock Deck
k this deck
5
Demand (sales) forecasts serve as inputs to financial, marketing, and personnel planning.
Unlock Deck
Unlock for access to all 142 flashcards in this deck.
Unlock Deck
k this deck
6
In trend projection, the trend component is the slope of the regression equation.
Unlock Deck
Unlock for access to all 142 flashcards in this deck.
Unlock Deck
k this deck
7
In trend projection, a negative regression slope is mathematically impossible.
Unlock Deck
Unlock for access to all 142 flashcards in this deck.
Unlock Deck
k this deck
8
A time-series model uses a series of past data points to make the forecast.
Unlock Deck
Unlock for access to all 142 flashcards in this deck.
Unlock Deck
k this deck
9
Linear-regression analysis is a straight-line mathematical model to describe the functional relationships between independent and dependent variables.
Unlock Deck
Unlock for access to all 142 flashcards in this deck.
Unlock Deck
k this deck
10
Patterns in the data that occur every several years are called circuits.
Unlock Deck
Unlock for access to all 142 flashcards in this deck.
Unlock Deck
k this deck
11
A naïve forecast for September sales of a product would be equal to the forecast for August.
Unlock Deck
Unlock for access to all 142 flashcards in this deck.
Unlock Deck
k this deck
12
One advantage of exponential smoothing is the limited amount of record keeping involved.
Unlock Deck
Unlock for access to all 142 flashcards in this deck.
Unlock Deck
k this deck
13
The larger the number of periods in the simple moving average forecasting method, the greater the method's responsiveness to changes in demand.
Unlock Deck
Unlock for access to all 142 flashcards in this deck.
Unlock Deck
k this deck
14
Seasonal indices adjust raw data for patterns that repeat at regular time intervals.
Unlock Deck
Unlock for access to all 142 flashcards in this deck.
Unlock Deck
k this deck
15
Cycles and random variations are both components of time series.
Unlock Deck
Unlock for access to all 142 flashcards in this deck.
Unlock Deck
k this deck
16
The quarterly "make meeting" of Lexus dealers is an example of a sales force composite forecast.
Unlock Deck
Unlock for access to all 142 flashcards in this deck.
Unlock Deck
k this deck
17
Forecasts of individual products tend to be more accurate than forecasts of product families.
Unlock Deck
Unlock for access to all 142 flashcards in this deck.
Unlock Deck
k this deck
18
The larger the standard error of the estimate, the more accurate the forecasting model.
Unlock Deck
Unlock for access to all 142 flashcards in this deck.
Unlock Deck
k this deck
19
A naive forecast for September sales of a product would be equal to the sales in August.
Unlock Deck
Unlock for access to all 142 flashcards in this deck.
Unlock Deck
k this deck
20
Most forecasting techniques assume that there is some underlying stability in the system.
Unlock Deck
Unlock for access to all 142 flashcards in this deck.
Unlock Deck
k this deck
21
In a regression equation where Y is demand and X is advertising, a coefficient of determination (R2) of .70 means that 70% of the variance in advertising is explained by demand.
Unlock Deck
Unlock for access to all 142 flashcards in this deck.
Unlock Deck
k this deck
22
The forecasting model that pools the opinions of a group of experts or managers is known as the
A) expert judgment model
B) multiple regression model
C) jury of executive opinion model
D) consumer market survey model
E) management coefficients model
A) expert judgment model
B) multiple regression model
C) jury of executive opinion model
D) consumer market survey model
E) management coefficients model
Unlock Deck
Unlock for access to all 142 flashcards in this deck.
Unlock Deck
k this deck
23
Forecasts are usually classified by time horizon into three categories
A) short-range, medium-range, and long-range
B) finance/accounting, marketing, and operations
C) strategic, tactical, and operational
D) exponential smoothing, regression, and time series
E) departmental, organizational, and industrial
A) short-range, medium-range, and long-range
B) finance/accounting, marketing, and operations
C) strategic, tactical, and operational
D) exponential smoothing, regression, and time series
E) departmental, organizational, and industrial
Unlock Deck
Unlock for access to all 142 flashcards in this deck.
Unlock Deck
k this deck
24
A forecast with a time horizon of about 3 months to 3 years is typically called a
A) long-range forecast
B) medium-range forecast
C) short-range forecast
D) weather forecast
E) strategic forecast
A) long-range forecast
B) medium-range forecast
C) short-range forecast
D) weather forecast
E) strategic forecast
Unlock Deck
Unlock for access to all 142 flashcards in this deck.
Unlock Deck
k this deck
25
Which of the following is not a step in the forecasting process?
A) Determine the use of the forecast.
B) Eliminate any assumptions.
C) Determine the time horizon.
D) Select forecasting model.
E) Validate and implement the results.
A) Determine the use of the forecast.
B) Eliminate any assumptions.
C) Determine the time horizon.
D) Select forecasting model.
E) Validate and implement the results.
Unlock Deck
Unlock for access to all 142 flashcards in this deck.
Unlock Deck
k this deck
26
Demand cycles for individual products can be driven by product life cycles.
Unlock Deck
Unlock for access to all 142 flashcards in this deck.
Unlock Deck
k this deck
27
Forecasts
A) become more accurate with longer time horizons
B) are rarely perfect
C) are more accurate for individual items than for groups of items
D) all of the above
E) none of the above
A) become more accurate with longer time horizons
B) are rarely perfect
C) are more accurate for individual items than for groups of items
D) all of the above
E) none of the above
Unlock Deck
Unlock for access to all 142 flashcards in this deck.
Unlock Deck
k this deck
28
Forecasts used for new product planning, capital expenditures, facility location or expansion, and R&D typically utilize a
A) short-range time horizon
B) medium-range time horizon
C) long-range time horizon
D) naive method, because there is no data history
E) all of the above
A) short-range time horizon
B) medium-range time horizon
C) long-range time horizon
D) naive method, because there is no data history
E) all of the above
Unlock Deck
Unlock for access to all 142 flashcards in this deck.
Unlock Deck
k this deck
29
Technological forecasts address the business cycle by predicting inflation rates, money supplies, housing starts, and other planning indicators.
Unlock Deck
Unlock for access to all 142 flashcards in this deck.
Unlock Deck
k this deck
30
Focus forecasting tries a variety of computer models and selects the best one for a particular application.
Unlock Deck
Unlock for access to all 142 flashcards in this deck.
Unlock Deck
k this deck
31
Many service firms use point-of-sale computers to collect detailed records needed for accurate short-term forecasts.
Unlock Deck
Unlock for access to all 142 flashcards in this deck.
Unlock Deck
k this deck
32
Which of the following techniques uses variables such as price and promotional expenditures, which are related to product demand, to predict demand?
A) associative models
B) exponential smoothing
C) weighted moving average
D) simple moving average
E) time series
A) associative models
B) exponential smoothing
C) weighted moving average
D) simple moving average
E) time series
Unlock Deck
Unlock for access to all 142 flashcards in this deck.
Unlock Deck
k this deck
33
Which of the following uses three types of participants: decision makers, staff personnel, and respondents?
A) executive opinions
B) sales force composites
C) the Delphi method
D) associative models
E) time series analysis
A) executive opinions
B) sales force composites
C) the Delphi method
D) associative models
E) time series analysis
Unlock Deck
Unlock for access to all 142 flashcards in this deck.
Unlock Deck
k this deck
34
One use of short-range forecasts is to determine
A) planning for new products
B) capital expenditures
C) research and development plans
D) facility location
E) job assignments
A) planning for new products
B) capital expenditures
C) research and development plans
D) facility location
E) job assignments
Unlock Deck
Unlock for access to all 142 flashcards in this deck.
Unlock Deck
k this deck
35
What two numbers are contained in the daily report to the CEO of Walt Disney Parks & Resorts regarding the six Orlando parks?
A) yesterday's forecasted attendance and yesterday's actual attendance
B) yesterday's actual attendance and today's forecasted attendance
C) yesterday's forecasted attendance and today's forecasted attendance
D) yesterday's actual attendance and last year's actual attendance
E) yesterday's forecasted attendance and the year-to-date average daily forecast error
Unlock Deck
Unlock for access to all 142 flashcards in this deck.
Unlock Deck
k this deck
36
Regression lines graphically depict "cause-and-effect" relationships.
Unlock Deck
Unlock for access to all 142 flashcards in this deck.
Unlock Deck
k this deck
37
If a forecast is consistently greater than (or less than) actual values, the forecast is said to be biased.
Unlock Deck
Unlock for access to all 142 flashcards in this deck.
Unlock Deck
k this deck
38
Which of the following is not a type of qualitative forecasting?
A) executive opinions
B) sales force composites
C) consumer surveys
D) the Delphi method
E) moving average
A) executive opinions
B) sales force composites
C) consumer surveys
D) the Delphi method
E) moving average
Unlock Deck
Unlock for access to all 142 flashcards in this deck.
Unlock Deck
k this deck
39
The two general approaches to forecasting are
A) qualitative and quantitative
B) mathematical and statistical
C) judgmental and qualitative
D) historical and associative
E) judgmental and associative
A) qualitative and quantitative
B) mathematical and statistical
C) judgmental and qualitative
D) historical and associative
E) judgmental and associative
Unlock Deck
Unlock for access to all 142 flashcards in this deck.
Unlock Deck
k this deck
40
Organizations use which three major types of forecasts, including two that may fall outside the role of the operations manager?
A) strategic, tactical, and operational
B) economic, technological, and demand
C) exponential smoothing, Delphi, and regression
D) causal, time-series, and seasonal
E) departmental, organizational, and territorial
A) strategic, tactical, and operational
B) economic, technological, and demand
C) exponential smoothing, Delphi, and regression
D) causal, time-series, and seasonal
E) departmental, organizational, and territorial
Unlock Deck
Unlock for access to all 142 flashcards in this deck.
Unlock Deck
k this deck
41
Which of the following statements comparing the weighted moving average technique and exponential smoothing is true?
A) Exponential smoothing is more easily used in combination with the Delphi method.
B) More emphasis can be placed on recent values using the weighted moving average.
C) Exponential smoothing is considerably more difficult to implement on a computer.
D) Exponential smoothing typically requires less record keeping of past data.
E) Exponential smoothing allows one to develop forecasts for multiple periods, whereas weighted moving averages does not.
Unlock Deck
Unlock for access to all 142 flashcards in this deck.
Unlock Deck
k this deck
42
What is the approximate forecast for May using a four-month moving average?
A) 38
B) 42
C) 43
D) 44
E) 47
A) 38
B) 42
C) 43
D) 44
E) 47
Unlock Deck
Unlock for access to all 142 flashcards in this deck.
Unlock Deck
k this deck
43
In time series, which of the following cannot be predicted?
A) large increases in demand
B) cycles
C) seasonal fluctuations
D) random fluctuations
E) large decreases in demand
A) large increases in demand
B) cycles
C) seasonal fluctuations
D) random fluctuations
E) large decreases in demand
Unlock Deck
Unlock for access to all 142 flashcards in this deck.
Unlock Deck
k this deck
44
Which is not a characteristic of exponential smoothing?
A) smoothes random variations in the data
B) easily altered weighting scheme
C) weights each historical value equally
D) has minimal data storage requirements
E) None of the above; they are all characteristics of exponential smoothing.
A) smoothes random variations in the data
B) easily altered weighting scheme
C) weights each historical value equally
D) has minimal data storage requirements
E) None of the above; they are all characteristics of exponential smoothing.
Unlock Deck
Unlock for access to all 142 flashcards in this deck.
Unlock Deck
k this deck
45
Given an actual demand of 61, a previous forecast of 58, and an alpha of .3, what would the forecast for the next period be using simple exponential smoothing?
A) 45.5
B) 57.1
C) 58.9
D) 61.0
E) 65.5
A) 45.5
B) 57.1
C) 58.9
D) 61.0
E) 65.5
Unlock Deck
Unlock for access to all 142 flashcards in this deck.
Unlock Deck
k this deck
46
Which time-series model below assumes that demand in the next period will be equal to the most recent period's demand?
A) naive approach
B) moving average approach
C) weighted moving average approach
D) exponential smoothing approach
E) none of the above
A) naive approach
B) moving average approach
C) weighted moving average approach
D) exponential smoothing approach
E) none of the above
Unlock Deck
Unlock for access to all 142 flashcards in this deck.
Unlock Deck
k this deck
47
A forecasting method has produced the following over the past five months. What is the mean absolute deviation?
A) -0.2
B) -1.0
C) 0.0
D) 1.2
E) 8.6
A) -0.2
B) -1.0
C) 0.0
D) 1.2
E) 8.6
Unlock Deck
Unlock for access to all 142 flashcards in this deck.
Unlock Deck
k this deck
48
Gradual movement in time-series data over time is called
A) seasonal variation
B) a cycle
C) a trend
D) exponential variation
E) random variation
A) seasonal variation
B) a cycle
C) a trend
D) exponential variation
E) random variation
Unlock Deck
Unlock for access to all 142 flashcards in this deck.
Unlock Deck
k this deck
49
John's House of Pancakes uses a weighted moving average method to forecast pancake sales. It assigns a weight of 5 to the previous month's demand, 3 to demand two months ago, and 1 to demand three months ago. If sales amounted to 1000 pancakes in May, 2200 pancakes in June, and 3000 pancakes in July, what should be the forecast for August?
A) 2400
B) 2511
C) 2067
D) 3767
E) 1622
A) 2400
B) 2511
C) 2067
D) 3767
E) 1622
Unlock Deck
Unlock for access to all 142 flashcards in this deck.
Unlock Deck
k this deck
50
A six-month moving average forecast is generally better than a three-month moving average forecast if demand
A) is rather stable
B) has been changing due to recent promotional efforts
C) follows a downward trend
D) exceeds one million units per year
E) follows an upward trend
A) is rather stable
B) has been changing due to recent promotional efforts
C) follows a downward trend
D) exceeds one million units per year
E) follows an upward trend
Unlock Deck
Unlock for access to all 142 flashcards in this deck.
Unlock Deck
k this deck
51
Which of the following is not present in a time series?
A) seasonality
B) operational variations
C) trend
D) cycles
E) random variations
A) seasonality
B) operational variations
C) trend
D) cycles
E) random variations
Unlock Deck
Unlock for access to all 142 flashcards in this deck.
Unlock Deck
k this deck
52
Given an actual demand of 103, a previous forecast value of 99, and an alpha of .4, the exponential smoothing forecast for the next period would be
A) 94.6
B) 97.4
C) 100.6
D) 101.6
E) 103.0
A) 94.6
B) 97.4
C) 100.6
D) 101.6
E) 103.0
Unlock Deck
Unlock for access to all 142 flashcards in this deck.
Unlock Deck
k this deck
53
Which of the following statements about time-series forecasting is true?
A) It is based on the assumption that future demand will be the same as past demand.
B) It makes extensive use of the data collected in the qualitative approach.
C) It is based on the assumption that the analysis of past demand helps predict future demand.
D) Because it accounts for trends, cycles, and seasonal patterns, it is always more powerful than associative forecasting.
E) All of the above are true.
Unlock Deck
Unlock for access to all 142 flashcards in this deck.
Unlock Deck
k this deck
54
A forecast based on the previous forecast plus a percentage of the forecast error is a(n)
A) qualitative forecast
B) naive forecast
C) moving average forecast
D) weighted moving average forecast
E) exponentially smoothed forecast
A) qualitative forecast
B) naive forecast
C) moving average forecast
D) weighted moving average forecast
E) exponentially smoothed forecast
Unlock Deck
Unlock for access to all 142 flashcards in this deck.
Unlock Deck
k this deck
55
The fundamental difference between cycles and seasonality is the
A) duration of the repeating patterns
B) magnitude of the variation
C) ability to attribute the pattern to a cause
D) all of the above
E) none of the above
A) duration of the repeating patterns
B) magnitude of the variation
C) ability to attribute the pattern to a cause
D) all of the above
E) none of the above
Unlock Deck
Unlock for access to all 142 flashcards in this deck.
Unlock Deck
k this deck
56
Time-series data may exhibit which of the following behaviors?
A) trend
B) random variations
C) seasonality
D) cycles
E) They may exhibit all of the above.
A) trend
B) random variations
C) seasonality
D) cycles
E) They may exhibit all of the above.
Unlock Deck
Unlock for access to all 142 flashcards in this deck.
Unlock Deck
k this deck
57
Increasing the number of periods in a moving average will accomplish greater smoothing, but at the expense of
A) manager understanding
B) accuracy
C) stability
D) responsiveness to changes
E) All of the above are diminished when the number of periods increases.
A) manager understanding
B) accuracy
C) stability
D) responsiveness to changes
E) All of the above are diminished when the number of periods increases.
Unlock Deck
Unlock for access to all 142 flashcards in this deck.
Unlock Deck
k this deck
58
Which of the following values of alpha would cause exponential smoothing to respond the most slowly to forecast errors?
A) 0.10
B) 0.20
C) 0.40
D) 0.80
E) cannot be determined
A) 0.10
B) 0.20
C) 0.40
D) 0.80
E) cannot be determined
Unlock Deck
Unlock for access to all 142 flashcards in this deck.
Unlock Deck
k this deck
59
Which time-series model uses past forecasts and past demand data to generate a new forecast?
A) naive
B) moving average
C) weighted moving average
D) exponential smoothing
E) regression analysis
A) naive
B) moving average
C) weighted moving average
D) exponential smoothing
E) regression analysis
Unlock Deck
Unlock for access to all 142 flashcards in this deck.
Unlock Deck
k this deck
60
Which of the following smoothing constants would make an exponential smoothing forecast equivalent to a naive forecast?
A) 0
B) 1 divided by the number of periods
C) 0.5
D) 1.0
E) cannot be determined
A) 0
B) 1 divided by the number of periods
C) 0.5
D) 1.0
E) cannot be determined
Unlock Deck
Unlock for access to all 142 flashcards in this deck.
Unlock Deck
k this deck
61
A time series trend equation is 25.3 + 2.1 X. What is your forecast for period 7?
A) 23.2
B) 25.3
C) 27.4
D) 40.0
E) cannot be determined
A) 23.2
B) 25.3
C) 27.4
D) 40.0
E) cannot be determined
Unlock Deck
Unlock for access to all 142 flashcards in this deck.
Unlock Deck
k this deck
62
Many services maintain records of sales noting
A) the day of the week
B) unusual events
C) weather
D) holidays
E) all of the above
A) the day of the week
B) unusual events
C) weather
D) holidays
E) all of the above
Unlock Deck
Unlock for access to all 142 flashcards in this deck.
Unlock Deck
k this deck
63
Which of the following is true regarding the two smoothing constants of the Forecast Including Trend (FIT) model?
A) One constant is positive, while the other is negative.
B) They are called MAD and cumulative error.
C) Alpha is always smaller than beta.
D) One constant smoothes the regression intercept, whereas the other smoothes the regression slope.
E) Their values are determined independently.
A) One constant is positive, while the other is negative.
B) They are called MAD and cumulative error.
C) Alpha is always smaller than beta.
D) One constant smoothes the regression intercept, whereas the other smoothes the regression slope.
E) Their values are determined independently.
Unlock Deck
Unlock for access to all 142 flashcards in this deck.
Unlock Deck
k this deck
64
__________ expresses the error as a percent of the actual values, undistorted by a single large value.
A) MAD
B) MSE
C) MAPE
D) FIT
E) The smoothing constant
A) MAD
B) MSE
C) MAPE
D) FIT
E) The smoothing constant
Unlock Deck
Unlock for access to all 142 flashcards in this deck.
Unlock Deck
k this deck
65
A fundamental distinction between trend projection and linear regression is that
A) trend projection uses least squares while linear regression does not
B) only linear regression can have a negative slope
C) in trend projection the independent variable is time; in linear regression the independent variable need not be time, but can be any variable with explanatory power
D) trend projection can be a function of several variables, while linear regression can only be a function of one variable
E) trend projection uses two smoothing constants, not just one
Unlock Deck
Unlock for access to all 142 flashcards in this deck.
Unlock Deck
k this deck
66
Yamaha manufactures which set of products with complementary demands to address seasonal fluctuations?
A) golf clubs and skis
B) swimming suits and winter jackets
C) jet skis and snowmobiles
D) pianos and guitars
E) ice skates and water skis
A) golf clubs and skis
B) swimming suits and winter jackets
C) jet skis and snowmobiles
D) pianos and guitars
E) ice skates and water skis
Unlock Deck
Unlock for access to all 142 flashcards in this deck.
Unlock Deck
k this deck
67
If two variables were perfectly correlated, the correlation coefficient r would equal
A) 0
B) -1
C) 1
D) B or C
E) none of the above
A) 0
B) -1
C) 1
D) B or C
E) none of the above
Unlock Deck
Unlock for access to all 142 flashcards in this deck.
Unlock Deck
k this deck
68
For a given product demand, the time series trend equation is 53 - 4 X. The negative sign on the slope of the equation
A) is a mathematical impossibility
B) is an indication that the forecast is biased, with forecast values lower than actual values
C) is an indication that product demand is declining
D) implies that the coefficient of determination will also be negative
E) implies that the cumulative error will be negative
Unlock Deck
Unlock for access to all 142 flashcards in this deck.
Unlock Deck
k this deck
69
The last four weekly values of sales were 80, 100, 105, and 90 units. The last four forecasts were 60, 80, 95, and 75 units. These forecasts illustrate
A) qualitative methods
B) adaptive smoothing
C) slope
D) bias
E) trend projection
A) qualitative methods
B) adaptive smoothing
C) slope
D) bias
E) trend projection
Unlock Deck
Unlock for access to all 142 flashcards in this deck.
Unlock Deck
k this deck
70
The primary purpose of the mean absolute deviation (MAD) in forecasting is to
A) estimate the trend line
B) eliminate forecast errors
C) measure forecast accuracy
D) seasonally adjust the forecast
E) all of the above
A) estimate the trend line
B) eliminate forecast errors
C) measure forecast accuracy
D) seasonally adjust the forecast
E) all of the above
Unlock Deck
Unlock for access to all 142 flashcards in this deck.
Unlock Deck
k this deck
71
The last four months of sales were 8, 10, 15, and 9 units. The last four forecasts were 5, 6, 11, and 12 units. The Mean Absolute Deviation (MAD) is
A) 2
B) -10
C) 3.5
D) 9
E) 10.5
A) 2
B) -10
C) 3.5
D) 9
E) 10.5
Unlock Deck
Unlock for access to all 142 flashcards in this deck.
Unlock Deck
k this deck
72
Demand for a certain product is forecast to be 800 units per month, averaged over all 12 months of the year. The product follows a seasonal pattern, for which the January monthly index is 1.25. What is the seasonally-adjusted sales forecast for January?
A) 640 units
B) 798.75 units
C) 801.25 units
D) 1000 units
E) 88.33 units
A) 640 units
B) 798.75 units
C) 801.25 units
D) 1000 units
E) 88.33 units
Unlock Deck
Unlock for access to all 142 flashcards in this deck.
Unlock Deck
k this deck
73
Given forecast errors of -1, 4, 8, and -3, what is the mean absolute deviation?
A) 2
B) 3
C) 4
D) 8
E) 16
A) 2
B) 3
C) 4
D) 8
E) 16
Unlock Deck
Unlock for access to all 142 flashcards in this deck.
Unlock Deck
k this deck
74
A seasonal index for a monthly series is about to be calculated on the basis of three years' accumulation of data. The three previous July values were 110, 150, and 130. The average over all months is 190. The approximate seasonal index for July is
A) 0.487
B) 0.684
C) 1.462
D) 2.053
E) cannot be calculated with the information given
A) 0.487
B) 0.684
C) 1.462
D) 2.053
E) cannot be calculated with the information given
Unlock Deck
Unlock for access to all 142 flashcards in this deck.
Unlock Deck
k this deck
75
Taco Bell's unique employee scheduling practices are partly the result of using
A) point-of-sale computers to track food sales in 15 minute intervals
B) focus forecasting
C) a six-week moving average forecasting technique
D) multiple regression
E) A and C are both correct.
A) point-of-sale computers to track food sales in 15 minute intervals
B) focus forecasting
C) a six-week moving average forecasting technique
D) multiple regression
E) A and C are both correct.
Unlock Deck
Unlock for access to all 142 flashcards in this deck.
Unlock Deck
k this deck
76
Suppose that demand in period 1 was 7 units and the demand in period 2 was 9 units. Assume that the forecast for period 1 was for 5 units. If the firm uses exponential smoothing with an alpha value of .20, what should be the forecast for period 3? (Round answers to two decimal places.)
A) 9.00
B) 3.72
C) 9.48
D) 5.00
E) 6.12
A) 9.00
B) 3.72
C) 9.48
D) 5.00
E) 6.12
Unlock Deck
Unlock for access to all 142 flashcards in this deck.
Unlock Deck
k this deck
77
The tracking signal is the
A) standard error of the estimate
B) absolute deviation of the last period's forecast
C) mean absolute deviation (MAD)
D) ratio of cumulative error/MAD
E) mean absolute percentage error (MAPE)
A) standard error of the estimate
B) absolute deviation of the last period's forecast
C) mean absolute deviation (MAD)
D) ratio of cumulative error/MAD
E) mean absolute percentage error (MAPE)
Unlock Deck
Unlock for access to all 142 flashcards in this deck.
Unlock Deck
k this deck
78
The degree or strength of a relationship between two variables is shown by the
A) alpha
B) mean
C) mean absolute deviation
D) correlation coefficient
E) cumulative error
A) alpha
B) mean
C) mean absolute deviation
D) correlation coefficient
E) cumulative error
Unlock Deck
Unlock for access to all 142 flashcards in this deck.
Unlock Deck
k this deck
79
Computer monitoring of tracking signals and self-adjustment if a signal passes a preset limit is characteristic of
A) exponential smoothing including trend
B) adaptive smoothing
C) trend projection
D) focus forecasting
E) multiple regression analysis
A) exponential smoothing including trend
B) adaptive smoothing
C) trend projection
D) focus forecasting
E) multiple regression analysis
Unlock Deck
Unlock for access to all 142 flashcards in this deck.
Unlock Deck
k this deck
80
Which of the following most requires long-range forecasting (as opposed to short-range or medium-range forecasting) for its planning purposes?
A) job scheduling
B) production levels
C) cash budgeting
D) capital expenditures
E) purchasing
A) job scheduling
B) production levels
C) cash budgeting
D) capital expenditures
E) purchasing
Unlock Deck
Unlock for access to all 142 flashcards in this deck.
Unlock Deck
k this deck
Unlock Deck
Unlock for access to all 142 flashcards in this deck.


