Deck 15: Statistical Quality Control
Full screen (f)
Question
Question
Question
Question
Question
Question
Question
Question
Question
Question
Question
Question
Question
Question
Question
Question
Question
Question
Question
Question
Question
 charts indicate changes in
A)variation.
B)central tendency.
C)natural variations.
D)numbers of defects.
Question
Question
Table 15-1

Refer to Table 15-1.Bags of chocolate candy are sampled to ensure proper weight.The overall average for the samples is 36 ounces.Each sample contains eight bags.The average range is 1.3 ounces.The lower control chart limit for the sample averages would be
A)36.3730.
B)36.4849.
C)35.6270.
D)35.5150.
Refer to Table 15-1.Bags of chocolate candy are sampled to ensure proper weight.The overall average for the samples is 36 ounces.Each sample contains eight bags.The average range is 1.3 ounces.The lower control chart limit for the sample averages would be
A)36.3730.
B)36.4849.
C)35.6270.
D)35.5150.
Question
Table 15-1
Refer to Table 15-1.Bags of chocolate candy are sampled to ensure proper weight.The overall average for the samples is 36 ounces.Each sample contains twelve bags.The average range is 1.3 ounces.The upper control chart limit for the sample averages would be
A)36.3458.
B)35.6542.
C)38.3101.
D)36.6279.
Question
Question
Question
Question
Question
Question
Question
Question
Question
The  -chart would be useful when we
A)took a number of measurements and computed the average.
B)took a number of measurements and computed the ranges.
C)found the fraction of the production lot defective.
D)found the number of defective items in a production lot.
-chart would be useful when weA)took a number of measurements and computed the average.
B)took a number of measurements and computed the ranges.
C)found the fraction of the production lot defective.
D)found the number of defective items in a production lot.
Question
Question
Question
Question
Table 15-1
Refer to Table 15-1.To guarantee that cans of soup are properly filled, some cans are sampled and the amounts measured.The overall average for the samples is 12 ounces.Each sample contains 10 cans.The average range is 0.4 ounces.The upper control chart limit for the sample averages would be
A)12.1232.
B)11.8768.
C)13.2.
D)12.308.
Question
Question
Question
Question
Question
Question
Question
Question
Question
Question
Question
Table 15-1
Refer to Table 15-1.To guarantee that cans of soda are properly filled, some cans are sampled and the amounts measured.The overall average for the samples is 12 ounces.Each sample contains 10 cans.The average range is 0.4 ounces.The lower control chart limit for the sample averages would be
A)12.1232.
B)11.8768.
C)13.2.
D)12.308.
Question
Table 15-1
Refer to Table 15-1.The Pristine Paint Company produces paint in gallon cans.They have found that in more than 10 samples of 8 cans each, the average gallon can contains 1.1 gallons of paint.The average range found over these samples is 0.15 gallons.What is the upper control limit for the sample averages in this process?
A)1.100
B)1.150
C)1.268
D)1.156
Question
Question
Question
Table 15-1
Refer to Table 15-1.The average range of a process for packaging cereal is 1.1 ounces.If the sample size is 10, find the lower control chart limit for the range chart.
A)0.245
B)1.955
C)1.777
D)0.223
Refer to Table 15-1.The average range of a process for packaging cereal is 1.1 ounces.If the sample size is 10, find the lower control chart limit for the range chart.
A)0.245
B)1.955
C)1.777
D)0.223
Question
Table 15-1
Refer to Table 15-1.Bags of tea are sampled to ensure proper weight.The overall average for the samples is 8 ounces.Each sample contains 10 bags.The average range is 0.1 ounces.What is the lower limit of the sample averages chart?
A)7.9692
B)8.0308
C)7.9076
D)8.0924
Refer to Table 15-1.Bags of tea are sampled to ensure proper weight.The overall average for the samples is 8 ounces.Each sample contains 10 bags.The average range is 0.1 ounces.What is the lower limit of the sample averages chart?
A)7.9692
B)8.0308
C)7.9076
D)8.0924
Question
Question
Question
Question
Question
Question
Table 15-1
Refer to Table 15-1.The average range of a process for packaging cereal is 1.1 ounces.If the sample size is 10, find the upper control chart limit for the range chart.
A)0.245
B)1.955
C)1.777
D)0.223
Refer to Table 15-1.The average range of a process for packaging cereal is 1.1 ounces.If the sample size is 10, find the upper control chart limit for the range chart.
A)0.245
B)1.955
C)1.777
D)0.223
Question
Question
Question
Question
Table 15-2
Given the sample results (100 units in each sample):
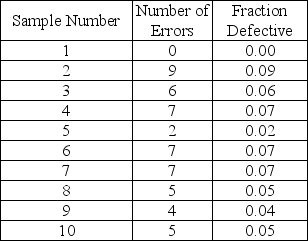
Based on Table 15-2, find the 95.5% lower limit of the appropriate p-chart.
A)0.0076
B)0.0964
C)0.2014
D)0.1397
Given the sample results (100 units in each sample):
Based on Table 15-2, find the 95.5% lower limit of the appropriate p-chart.
A)0.0076
B)0.0964
C)0.2014
D)0.1397
Question
Question
Question
Question
Question
Table 15-1
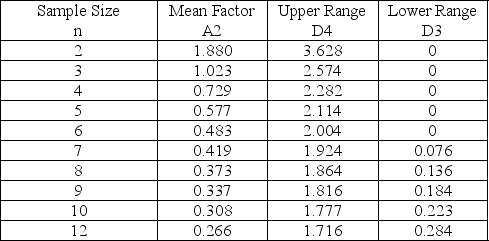
Use the data shown below and the information in Table 15-1 to develop an upper control limit for a control chart that monitors consistency.What is the upper control limit?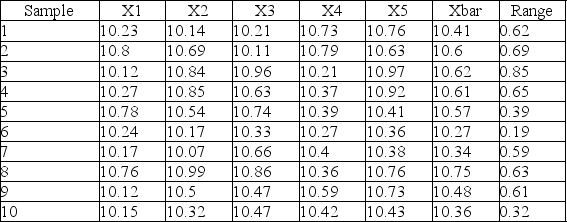
A)2.11
B)6.38
C)10.82
D)1.17
Use the data shown below and the information in Table 15-1 to develop an upper control limit for a control chart that monitors consistency.What is the upper control limit?
A)2.11
B)6.38
C)10.82
D)1.17
Question
Question
Question
Question
Question
Question
Question
Question
Question
Question
Question
Question
Table 15-1
Use the data shown below and the information in Table 15-1 to develop an upper control limit for a control chart that monitors central tendency.What is the upper control limit?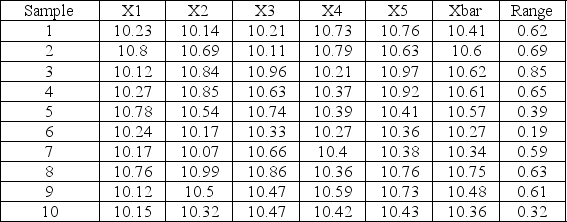
A)0
B)1.17
C)10.82
D)11.99
Use the data shown below and the information in Table 15-1 to develop an upper control limit for a control chart that monitors central tendency.What is the upper control limit?
A)0
B)1.17
C)10.82
D)11.99

Unlock Deck
Sign up to unlock the cards in this deck!
Unlock Deck
Unlock Deck
1/96
Play
Full screen (f)
Deck 15: Statistical Quality Control
1
TQM emphasizes quality of the goods or service-producing division of the company.
False
2
A p-chart could be used to monitor the average weight of cereal boxes.
False
3
If we are tracking quality of performance for a class of students, we should plot the individual grades on an x-bar chart, and the pass/fail result on a p-chart.
True
4
P-charts and c-charts are examples of control charts for variables.
Unlock Deck
Unlock for access to all 96 flashcards in this deck.
Unlock Deck
k this deck
5
An x-bar chart would be appropriate to monitor the number of defects in a production lot.
Unlock Deck
Unlock for access to all 96 flashcards in this deck.
Unlock Deck
k this deck
6
A c-chart would be appropriate to monitor the number of weld defects on the steel plates of a ship's hull.
Unlock Deck
Unlock for access to all 96 flashcards in this deck.
Unlock Deck
k this deck
7
It is impossible to develop a process that has zero variability.
Unlock Deck
Unlock for access to all 96 flashcards in this deck.
Unlock Deck
k this deck
8
Technically, to achieve Six Sigma quality, there would have to be fewer than 3.4 defects per million opportunities.
Unlock Deck
Unlock for access to all 96 flashcards in this deck.
Unlock Deck
k this deck
9
Samples sizes of five are often used when building control charts.
Unlock Deck
Unlock for access to all 96 flashcards in this deck.
Unlock Deck
k this deck
10
If we are attempting to control the diameter of bowling balls, we will find a p-chart to be quite helpful.
Unlock Deck
Unlock for access to all 96 flashcards in this deck.
Unlock Deck
k this deck
11
C-charts are used to analyze the proportion defective in a sample.
Unlock Deck
Unlock for access to all 96 flashcards in this deck.
Unlock Deck
k this deck
12
The central limit theorem provides the statistical foundation for control charts.
Unlock Deck
Unlock for access to all 96 flashcards in this deck.
Unlock Deck
k this deck
13
Assignable variations in a process are also called natural variations.
Unlock Deck
Unlock for access to all 96 flashcards in this deck.
Unlock Deck
k this deck
14
Statistical process control uses regression and other forecasting tools to help control processes.
Unlock Deck
Unlock for access to all 96 flashcards in this deck.
Unlock Deck
k this deck
15
If all of the control points on a control chart lie between the UCL and the LCL, the process is always in control.
Unlock Deck
Unlock for access to all 96 flashcards in this deck.
Unlock Deck
k this deck
16
The independent axis of a control chart is time.
Unlock Deck
Unlock for access to all 96 flashcards in this deck.
Unlock Deck
k this deck
17
W.Edwards Deming introduced control charts in the 1920s.
Unlock Deck
Unlock for access to all 96 flashcards in this deck.
Unlock Deck
k this deck
18
Robert Pirsig defines quality as "Fitness for use."
Unlock Deck
Unlock for access to all 96 flashcards in this deck.
Unlock Deck
k this deck
19
The underlying distribution for a p-chart is binomial.
Unlock Deck
Unlock for access to all 96 flashcards in this deck.
Unlock Deck
k this deck
20
The U.S.government awards for quality achievement are called the Malcolm Baldrige National Quality Awards.
Unlock Deck
Unlock for access to all 96 flashcards in this deck.
Unlock Deck
k this deck
21
charts indicate changes inA)variation.
B)central tendency.
C)natural variations.
D)numbers of defects.
Unlock Deck
Unlock for access to all 96 flashcards in this deck.
Unlock Deck
k this deck
22
A company believes a process monitored by an x-bar chart to be in control.When the most recent control point exceeded the UCL value by 20%, the company should
A)believe that a random bad luck chance occurred and proceed.
B)suspect that an assignable cause of variation now exists and can be found.
C)ignore the control point completely, as it is simply an outlier.
D)wait for the next four samples to be taken to see if a trend develops.
A)believe that a random bad luck chance occurred and proceed.
B)suspect that an assignable cause of variation now exists and can be found.
C)ignore the control point completely, as it is simply an outlier.
D)wait for the next four samples to be taken to see if a trend develops.
Unlock Deck
Unlock for access to all 96 flashcards in this deck.
Unlock Deck
k this deck
23
Table 15-1
Refer to Table 15-1.Bags of chocolate candy are sampled to ensure proper weight.The overall average for the samples is 36 ounces.Each sample contains eight bags.The average range is 1.3 ounces.The lower control chart limit for the sample averages would be
A)36.3730.
B)36.4849.
C)35.6270.
D)35.5150.
Refer to Table 15-1.Bags of chocolate candy are sampled to ensure proper weight.The overall average for the samples is 36 ounces.Each sample contains eight bags.The average range is 1.3 ounces.The lower control chart limit for the sample averages would be
A)36.3730.
B)36.4849.
C)35.6270.
D)35.5150.
Unlock Deck
Unlock for access to all 96 flashcards in this deck.
Unlock Deck
k this deck
24
Table 15-1
Refer to Table 15-1.Bags of chocolate candy are sampled to ensure proper weight.The overall average for the samples is 36 ounces.Each sample contains twelve bags.The average range is 1.3 ounces.The upper control chart limit for the sample averages would be
A)36.3458.
B)35.6542.
C)38.3101.
D)36.6279.
Unlock Deck
Unlock for access to all 96 flashcards in this deck.
Unlock Deck
k this deck
25
For data that are appropriately handled by C-charts, the mean equals the variance.
Unlock Deck
Unlock for access to all 96 flashcards in this deck.
Unlock Deck
k this deck
26
Which of the following is not a popular definition of quality?
A)Quality is the totality of features and characteristics of a product or service that bears on its ability to satisfy stated or implied needs.
B)Quality is defined as a competitively priced product that surpasses customer needs.
C)Quality is the degree to which a product conforms to design or specification.
D)Quality is fitness for use.
Unlock Deck
Unlock for access to all 96 flashcards in this deck.
Unlock Deck
k this deck
27
All that is required to develop limits for a C-chart is knowledge of the average count of defects.
Unlock Deck
Unlock for access to all 96 flashcards in this deck.
Unlock Deck
k this deck
28
The area from two standard deviations above to two standard deviations below the mean of a normal distribution will contain 99.7% of all of the area under the curve.
Unlock Deck
Unlock for access to all 96 flashcards in this deck.
Unlock Deck
k this deck
29
Bags of pretzels are sampled to ensure proper weight.The overall average for the samples is 9 ounces.Each sample contains 25 bags.The standard deviation is estimated to be 3 ounces.The upper control chart limit (for 99.7% confidence)for the average would be ________ ounces.
A)9.4
B)18.0
C)10.2
D)10.8
A)9.4
B)18.0
C)10.2
D)10.8
Unlock Deck
Unlock for access to all 96 flashcards in this deck.
Unlock Deck
k this deck
30
Variations that usually occur in a process are called
A)process variations.
B)natural variations.
C)control variations.
D)assignable variations.
A)process variations.
B)natural variations.
C)control variations.
D)assignable variations.
Unlock Deck
Unlock for access to all 96 flashcards in this deck.
Unlock Deck
k this deck
31
Control charts that are used to monitor processes that are measured in continuous units are classified as which of the following?
A)control charts for attributes
B)control charts for variables
C)control charts for defects
D)control charts for quality
A)control charts for attributes
B)control charts for variables
C)control charts for defects
D)control charts for quality
Unlock Deck
Unlock for access to all 96 flashcards in this deck.
Unlock Deck
k this deck
32
R-charts measure changes in
A)central tendency.
B)degree of variation.
C)number of defects per production lot.
D)natural variations.
A)central tendency.
B)degree of variation.
C)number of defects per production lot.
D)natural variations.
Unlock Deck
Unlock for access to all 96 flashcards in this deck.
Unlock Deck
k this deck
33
The -chart would be useful when we
A)took a number of measurements and computed the average.
B)took a number of measurements and computed the ranges.
C)found the fraction of the production lot defective.
D)found the number of defective items in a production lot.
-chart would be useful when weA)took a number of measurements and computed the average.
B)took a number of measurements and computed the ranges.
C)found the fraction of the production lot defective.
D)found the number of defective items in a production lot.
Unlock Deck
Unlock for access to all 96 flashcards in this deck.
Unlock Deck
k this deck
34
Variations that need not occur in production processes are referred to as
A)assignable variations.
B)control variations.
C)natural variations.
D)process variations.
A)assignable variations.
B)control variations.
C)natural variations.
D)process variations.
Unlock Deck
Unlock for access to all 96 flashcards in this deck.
Unlock Deck
k this deck
35
The inspection of cans of juice involves sampling some cans and weighing them.The overall average for the samples is 39 ounces.Each sample contains 36 cans.The standard deviation is estimated to be 2 ounces.The 99.7% lower control chart limit for the average would be
A)37.67.
B)38.00.
C)39.33.
D)40.00.
A)37.67.
B)38.00.
C)39.33.
D)40.00.
Unlock Deck
Unlock for access to all 96 flashcards in this deck.
Unlock Deck
k this deck
36
The R-chart would be useful when we
A)took a number of measurements and computed the average.
B)took a number of measurements and computed the ranges.
C)found the fraction of the production lot defective.
D)found the number of defective items in a production lot.
A)took a number of measurements and computed the average.
B)took a number of measurements and computed the ranges.
C)found the fraction of the production lot defective.
D)found the number of defective items in a production lot.
Unlock Deck
Unlock for access to all 96 flashcards in this deck.
Unlock Deck
k this deck
37
Table 15-1
Refer to Table 15-1.To guarantee that cans of soup are properly filled, some cans are sampled and the amounts measured.The overall average for the samples is 12 ounces.Each sample contains 10 cans.The average range is 0.4 ounces.The upper control chart limit for the sample averages would be
A)12.1232.
B)11.8768.
C)13.2.
D)12.308.
Unlock Deck
Unlock for access to all 96 flashcards in this deck.
Unlock Deck
k this deck
38
Who introduced control charts in 1924?
A)W.Edwards Deming
B)Philip Crosby
C)J.M.Juran
D)Walter Shewhart
A)W.Edwards Deming
B)Philip Crosby
C)J.M.Juran
D)Walter Shewhart
Unlock Deck
Unlock for access to all 96 flashcards in this deck.
Unlock Deck
k this deck
39
The central limit theorem states that the distribution of x-bars will tend to follow a normal distribution as long as the population they are drawn from is normally distributed.
Unlock Deck
Unlock for access to all 96 flashcards in this deck.
Unlock Deck
k this deck
40
A run of four consecutive points above the center line is a sufficient reason to stop the process and investigate for cause.
Unlock Deck
Unlock for access to all 96 flashcards in this deck.
Unlock Deck
k this deck
41
Which of the following control charts is/are for variables?
A)x-bar chart only
B)R-chart only
C)p-chart only
D)both x-bar and R-charts
A)x-bar chart only
B)R-chart only
C)p-chart only
D)both x-bar and R-charts
Unlock Deck
Unlock for access to all 96 flashcards in this deck.
Unlock Deck
k this deck
42
Defects in computer hard-drives will usually render the entire computer worthless.For a particular model, the percent defective in the past has been 1%.If a sample size of 400 is taken, what would the 95.5% lower control chart limit be?
A)0.00995
B)0.00005
C)0.00000
D)0.01000
A)0.00995
B)0.00005
C)0.00000
D)0.01000
Unlock Deck
Unlock for access to all 96 flashcards in this deck.
Unlock Deck
k this deck
43
The p-chart would be useful when we
A)took a number of measurements and computed the average.
B)took a number of measurements and computed the ranges.
C)found the fraction of the production lot defective.
D)found the number of defective items in a production lot.
A)took a number of measurements and computed the average.
B)took a number of measurements and computed the ranges.
C)found the fraction of the production lot defective.
D)found the number of defective items in a production lot.
Unlock Deck
Unlock for access to all 96 flashcards in this deck.
Unlock Deck
k this deck
44
Which of the following statements is false regarding control charts?
A)X-bar charts measure central tendency in a process.
B)R-charts measure the variability of a process.
C)It is not possible to have a LCL below 0 in a c-chart.
D)The nominal line is always the midpoint between the UCL and LCL.
A)X-bar charts measure central tendency in a process.
B)R-charts measure the variability of a process.
C)It is not possible to have a LCL below 0 in a c-chart.
D)The nominal line is always the midpoint between the UCL and LCL.
Unlock Deck
Unlock for access to all 96 flashcards in this deck.
Unlock Deck
k this deck
45
A quality control program is being developed for batteries.The percent defective for these in the past has been 3%.If a sample size of 120 is taken, what would the 99.7% upper control chart limit be?
A)0.0812
B)0.0767
C)0.0611
D)0.0307
A)0.0812
B)0.0767
C)0.0611
D)0.0307
Unlock Deck
Unlock for access to all 96 flashcards in this deck.
Unlock Deck
k this deck
46
A p-chart is based on which of the following probability distributions?
A)Poisson
B)binomial
C)uniform
D)exponential
A)Poisson
B)binomial
C)uniform
D)exponential
Unlock Deck
Unlock for access to all 96 flashcards in this deck.
Unlock Deck
k this deck
47
Which of the following control charts is/are for attributes?
A)x-bar chart only
B)R-chart only
C)p-chart only
D)both x-bar and R-charts
A)x-bar chart only
B)R-chart only
C)p-chart only
D)both x-bar and R-charts
Unlock Deck
Unlock for access to all 96 flashcards in this deck.
Unlock Deck
k this deck
48
Table 15-1
Refer to Table 15-1.To guarantee that cans of soda are properly filled, some cans are sampled and the amounts measured.The overall average for the samples is 12 ounces.Each sample contains 10 cans.The average range is 0.4 ounces.The lower control chart limit for the sample averages would be
A)12.1232.
B)11.8768.
C)13.2.
D)12.308.
Unlock Deck
Unlock for access to all 96 flashcards in this deck.
Unlock Deck
k this deck
49
Table 15-1
Refer to Table 15-1.The Pristine Paint Company produces paint in gallon cans.They have found that in more than 10 samples of 8 cans each, the average gallon can contains 1.1 gallons of paint.The average range found over these samples is 0.15 gallons.What is the upper control limit for the sample averages in this process?
A)1.100
B)1.150
C)1.268
D)1.156
Unlock Deck
Unlock for access to all 96 flashcards in this deck.
Unlock Deck
k this deck
50
A c-chart is based on which of the following probability distributions?
A)Poisson
B)binomial
C)uniform
D)exponential
A)Poisson
B)binomial
C)uniform
D)exponential
Unlock Deck
Unlock for access to all 96 flashcards in this deck.
Unlock Deck
k this deck
51
The U.S.government award for quality achievement is the
A)Deming Prize.
B)Shewhart Symbol of Excellence.
C)Malcolm Baldrige National Quality Award.
D)Bush Award for Quality Management.
A)Deming Prize.
B)Shewhart Symbol of Excellence.
C)Malcolm Baldrige National Quality Award.
D)Bush Award for Quality Management.
Unlock Deck
Unlock for access to all 96 flashcards in this deck.
Unlock Deck
k this deck
52
Table 15-1
Refer to Table 15-1.The average range of a process for packaging cereal is 1.1 ounces.If the sample size is 10, find the lower control chart limit for the range chart.
A)0.245
B)1.955
C)1.777
D)0.223
Refer to Table 15-1.The average range of a process for packaging cereal is 1.1 ounces.If the sample size is 10, find the lower control chart limit for the range chart.
A)0.245
B)1.955
C)1.777
D)0.223
Unlock Deck
Unlock for access to all 96 flashcards in this deck.
Unlock Deck
k this deck
53
Table 15-1
Refer to Table 15-1.Bags of tea are sampled to ensure proper weight.The overall average for the samples is 8 ounces.Each sample contains 10 bags.The average range is 0.1 ounces.What is the lower limit of the sample averages chart?
A)7.9692
B)8.0308
C)7.9076
D)8.0924
Refer to Table 15-1.Bags of tea are sampled to ensure proper weight.The overall average for the samples is 8 ounces.Each sample contains 10 bags.The average range is 0.1 ounces.What is the lower limit of the sample averages chart?
A)7.9692
B)8.0308
C)7.9076
D)8.0924
Unlock Deck
Unlock for access to all 96 flashcards in this deck.
Unlock Deck
k this deck
54
An airline company tracks the number of lost bags that occur each day.This is best monitored by which of the following control charts?
A)x-bar chart
B)R-chart
C)p-chart
D)c-chart
A)x-bar chart
B)R-chart
C)p-chart
D)c-chart
Unlock Deck
Unlock for access to all 96 flashcards in this deck.
Unlock Deck
k this deck
55
Defects in marble countertops usually require the whole top to be reconstructed.In one kitchen shop, the percent defective in the past has been one percent.If a sample size of 30 is taken, what should the 95.5 percent upper control limit be?
A)0.030
B)0.000
C)0.046
D)0.064
A)0.030
B)0.000
C)0.046
D)0.064
Unlock Deck
Unlock for access to all 96 flashcards in this deck.
Unlock Deck
k this deck
56
A coffee dispenser is supposed to dispense coffee into an 8 o.z.cup.The average amount of coffee filled into the cup must be below 7.9.This is best monitored by which of the following control charts?
A)x-bar chart
B)R-chart
C)p-chart
D)c-chart
A)x-bar chart
B)R-chart
C)p-chart
D)c-chart
Unlock Deck
Unlock for access to all 96 flashcards in this deck.
Unlock Deck
k this deck
57
When receiving a shipment from a supplier, inspection must be done to check the fraction of defective products.This is best monitored by which of the following control charts?
A)x-bar chart
B)R-chart
C)p-chart
D)c-chart
A)x-bar chart
B)R-chart
C)p-chart
D)c-chart
Unlock Deck
Unlock for access to all 96 flashcards in this deck.
Unlock Deck
k this deck
58
Defects in the finish of new, custom automobiles usually require the whole body to be repainted.In one "custom" shop, the percentage of defective finishes has been 2 percent.If a sample size of 10 is taken, what should the 99.7 percent upper control limit be?
A)0.1328
B)0.1085
C)0.0443
D)0.1528
A)0.1328
B)0.1085
C)0.0443
D)0.1528
Unlock Deck
Unlock for access to all 96 flashcards in this deck.
Unlock Deck
k this deck
59
Table 15-1
Refer to Table 15-1.The average range of a process for packaging cereal is 1.1 ounces.If the sample size is 10, find the upper control chart limit for the range chart.
A)0.245
B)1.955
C)1.777
D)0.223
Refer to Table 15-1.The average range of a process for packaging cereal is 1.1 ounces.If the sample size is 10, find the upper control chart limit for the range chart.
A)0.245
B)1.955
C)1.777
D)0.223
Unlock Deck
Unlock for access to all 96 flashcards in this deck.
Unlock Deck
k this deck
60
A plant manager is concerned with the variability of beer being filled in 12 oz.cans.The most appropriate control chart would be which of the following?
A)x-bar chart
B)R-chart
C)p-chart
D)c-chart
A)x-bar chart
B)R-chart
C)p-chart
D)c-chart
Unlock Deck
Unlock for access to all 96 flashcards in this deck.
Unlock Deck
k this deck
61
The standard deviation of a process can be described as
A)a measure of dispersion.
B)the average value.
C)a measure of central tendency.
D)assignable variations.
A)a measure of dispersion.
B)the average value.
C)a measure of central tendency.
D)assignable variations.
Unlock Deck
Unlock for access to all 96 flashcards in this deck.
Unlock Deck
k this deck
62
Joe studied his control chart and noticed it had been built with repeated samples of ten units and three sigma limits that were UCL = 109.0125 and LCL = 90.9875.What is the process standard deviation?
A)9.5
B)6.7
C)5.2
D)3
A)9.5
B)6.7
C)5.2
D)3
Unlock Deck
Unlock for access to all 96 flashcards in this deck.
Unlock Deck
k this deck
63
Table 15-2
Given the sample results (100 units in each sample):
Based on Table 15-2, find the 95.5% lower limit of the appropriate p-chart.
A)0.0076
B)0.0964
C)0.2014
D)0.1397
Given the sample results (100 units in each sample):
Based on Table 15-2, find the 95.5% lower limit of the appropriate p-chart.
A)0.0076
B)0.0964
C)0.2014
D)0.1397
Unlock Deck
Unlock for access to all 96 flashcards in this deck.
Unlock Deck
k this deck
64
A company has been receiving complaints about the attitude of some sales clerks.Over a 10-day period, the total number of complaints was 360.The company wishes to develop a control chart for the number of complaints.What would the upper control limit on the number of complaints per day be for a 2 sigma (95.5%)control chart?
A)12
B)42
C)48
D)54
A)12
B)42
C)48
D)54
Unlock Deck
Unlock for access to all 96 flashcards in this deck.
Unlock Deck
k this deck
65
Which of these patterns on a control chart would require a worker to stop the process and investigate for an assignable cause?
A)a run of three consecutive points above the center line
B)a trend run of six consecutive points all decreasing
C)six consecutive points close to the center line
D)one point near the lower control limit
A)a run of three consecutive points above the center line
B)a trend run of six consecutive points all decreasing
C)six consecutive points close to the center line
D)one point near the lower control limit
Unlock Deck
Unlock for access to all 96 flashcards in this deck.
Unlock Deck
k this deck
66
The c-chart is useful when we
A)take a number of measurements and compute the average.
B)take a number of measurements and compute the ranges.
C)find the fraction of the production lot defective.
D)find the number of defective items in a production lot.
A)take a number of measurements and compute the average.
B)take a number of measurements and compute the ranges.
C)find the fraction of the production lot defective.
D)find the number of defective items in a production lot.
Unlock Deck
Unlock for access to all 96 flashcards in this deck.
Unlock Deck
k this deck
67
A company has been receiving complaints about the attitude of some sales clerks.Over a 10-day period, the total number of complaints was 250.The company wishes to develop a control chart for the number of complaints.What would the upper control limit on the number of complaints per day be for a 2 sigma (95.5%)control chart?
A)35
B)40
C)50
D)200
A)35
B)40
C)50
D)200
Unlock Deck
Unlock for access to all 96 flashcards in this deck.
Unlock Deck
k this deck
68
Table 15-1
Use the data shown below and the information in Table 15-1 to develop an upper control limit for a control chart that monitors consistency.What is the upper control limit?
A)2.11
B)6.38
C)10.82
D)1.17
Use the data shown below and the information in Table 15-1 to develop an upper control limit for a control chart that monitors consistency.What is the upper control limit?
A)2.11
B)6.38
C)10.82
D)1.17
Unlock Deck
Unlock for access to all 96 flashcards in this deck.
Unlock Deck
k this deck
69
A company has been receiving complaints about the attitude of some sales clerks.Over a 10-day period, the total number of complaints was 250.The company wishes to develop a control chart for the number of complaints.What would the lower control limit on the number of complaints per day be for a 3 sigma (99.7%)control chart?
A)20
B)0
C)15
D)10
A)20
B)0
C)15
D)10
Unlock Deck
Unlock for access to all 96 flashcards in this deck.
Unlock Deck
k this deck
70
The mean of a process can be described as
A)a measure of dispersion.
B)the average value.
C)the standard deviation.
D)a measure of consistency.
A)a measure of dispersion.
B)the average value.
C)the standard deviation.
D)a measure of consistency.
Unlock Deck
Unlock for access to all 96 flashcards in this deck.
Unlock Deck
k this deck
71
Baker studied his control chart and noticed it had been built with repeated samples of eight units and three sigma limits that were UCL = 73.07 and LCL = 58.93.What is the process standard deviation?
A)2.35
B)6.67
C)5.26
D)3.33
A)2.35
B)6.67
C)5.26
D)3.33
Unlock Deck
Unlock for access to all 96 flashcards in this deck.
Unlock Deck
k this deck
72
Which of these patterns on a control chart would require a worker to stop the process and investigate for an assignable cause?
A)a run of five points alternating up and down
B)a run of three consecutive points above the center line
C)two out of three points close to the center line
D)one point below the lower control limit
A)a run of five points alternating up and down
B)a run of three consecutive points above the center line
C)two out of three points close to the center line
D)one point below the lower control limit
Unlock Deck
Unlock for access to all 96 flashcards in this deck.
Unlock Deck
k this deck
73
A company has been receiving complaints about the attitude of some sales clerks.Over a 10-day period, the total number of complaints was 250.The company wishes to develop a control chart for the number of complaints.What would the lower control limit on the number of complaints per day be for a 2 sigma (95.5%)control chart?
A)20
B)0
C)15
D)10
A)20
B)0
C)15
D)10
Unlock Deck
Unlock for access to all 96 flashcards in this deck.
Unlock Deck
k this deck
74
Which of these patterns on a control chart would require a worker to stop the process and investigate for an assignable cause?
A)a run of five consecutive points below the center line
B)a run of three consecutive points all increasing
C)six consecutive points close to the center line
D)one point near the lower control limit
A)a run of five consecutive points below the center line
B)a run of three consecutive points all increasing
C)six consecutive points close to the center line
D)one point near the lower control limit
Unlock Deck
Unlock for access to all 96 flashcards in this deck.
Unlock Deck
k this deck
75
Technically, to achieve Six Sigma quality, there would have to be fewer than ________ defects per million opportunities.
A)6
B)166,667
C)67
D)3.4
A)6
B)166,667
C)67
D)3.4
Unlock Deck
Unlock for access to all 96 flashcards in this deck.
Unlock Deck
k this deck
76
A 400-student lecture in introductory statistics conducted by a tenured professor breaks into 20 sections of 20 students for problem sessions run by helpful graduate assistants that give weekly quizzes to lighten the mood.The graduate assistants determine their section averages for their quiz each week and compare the numbers.Which of these statements is best?
A)The standard deviation of the section averages should approach the overall standard deviation.
B)A graduate assistant whose section quiz average falls outside three sigma limits should be replaced.
C)For any given week, the section averages should be normally distributed.
D)95.5% of the section averages should fall within three standard deviations of the overall average.
Unlock Deck
Unlock for access to all 96 flashcards in this deck.
Unlock Deck
k this deck
77
A company is producing cylindrical blocks for a children's toy.The average diameter of a block is 3.5 inches.Sixteen blocks are inspected and the diameters are measured.The standard deviation is estimated to be 0.02 inches.What are the 99.7% upper and lower control limits for the x-bar chart?
Unlock Deck
Unlock for access to all 96 flashcards in this deck.
Unlock Deck
k this deck
78
Samaje studied his control chart and noticed it had been built with repeated samples of five units and three sigma limits that were UCL = 51.71 and LCL = 38.29.What is the process standard deviation?
A)3
B)1.732
C)2.236
D)5
A)3
B)1.732
C)2.236
D)5
Unlock Deck
Unlock for access to all 96 flashcards in this deck.
Unlock Deck
k this deck
79
A company has been receiving complaints about the attitude of some sales clerks.Over a 10-day period, the total number of complaints was 360.The company wishes to develop a control chart for the number of complaints.What would the upper control limit on the number of complaints per day be for a 3 sigma (99.7%)control chart?
A)18
B)36
C)42
D)54
A)18
B)36
C)42
D)54
Unlock Deck
Unlock for access to all 96 flashcards in this deck.
Unlock Deck
k this deck
80
Table 15-1
Use the data shown below and the information in Table 15-1 to develop an upper control limit for a control chart that monitors central tendency.What is the upper control limit?
A)0
B)1.17
C)10.82
D)11.99
Use the data shown below and the information in Table 15-1 to develop an upper control limit for a control chart that monitors central tendency.What is the upper control limit?
A)0
B)1.17
C)10.82
D)11.99
Unlock Deck
Unlock for access to all 96 flashcards in this deck.
Unlock Deck
k this deck
Unlock Deck
Unlock for access to all 96 flashcards in this deck.


