Exam 15: Statistical Quality Control
Exam 1: Introduction to Quantitative Analysis96 Questions
Exam 2: Probability Concepts and Applications155 Questions
Exam 3: Decision Analysis128 Questions
Exam 4: Regression Models129 Questions
Exam 5: Forecasting138 Questions
Exam 6: Inventory Control Models147 Questions
Exam 7: Linear Programming Models: Graphical and Computer Methods141 Questions
Exam 8: Linear Programming Applications89 Questions
Exam 9: Transportation, Assignment, and Network Models112 Questions
Exam 10: Integer Programming, Goal Programming, and Nonlinear Programming86 Questions
Exam 11: Project Management142 Questions
Exam 12: Waiting Lines and Queuing Theory Models127 Questions
Exam 13: Simulation Modeling94 Questions
Exam 14: Markov Analysis103 Questions
Exam 15: Statistical Quality Control96 Questions
Exam 16: Analytic Hierarchy Process66 Questions
Exam 17: Dynamic Programming86 Questions
Exam 18: Decision Theory and the Normal Distribution62 Questions
Exam 19: Game Theory59 Questions
Exam 20: Mathematical Tools: Determinants and Matrices104 Questions
Exam 21: Calculus-Based Optimization39 Questions
Exam 22: Linear Programming: The Simplex Method98 Questions
Exam 23: Transportation, Assignment, and Network Algorithms120 Questions
Select questions type
A coffee company is attempting to make certain that all its packaged coffee beans contain the same amount of coffee bean by weight.Over the last few days, it has taken several samples.The overall average weight of the sampled packages is 16 ounces, with an average range of 4 ounces.Each sample was of five packages.What would be the 99.7 upper and lower control limits for an  -chart?
Free
(Short Answer)
4.8/5  (41)
(41)
Correct Answer: Verified
LCL = 13.692 ounces UCL = 18.308 ounces
Defects in marble countertops usually require the whole top to be reconstructed.In one kitchen shop, the percent defective in the past has been one percent.If a sample size of 30 is taken, what should the 95.5 percent upper control limit be?
Free
(Multiple Choice)
4.8/5 (33)
Correct Answer:Verified
C
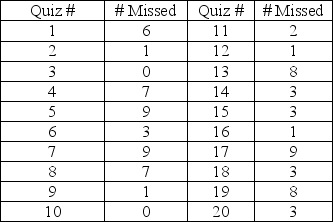
A professor gives a series of twenty quizzes in his operations planning and control class just to keep his students on their toes.Each quiz consists of fifty questions and the results for one student (the number of questions missed on each exam)are shown in the table.Construct an appropriate control chart for this situation.Is the student in control?
Free
(Essay)
5.0/5 (38)
Correct Answer:Verified
A c-chart is appropriate in this case because the quiz results show a count of the number of items missed.The c-bar is 4.2 with a UCL = 10.35 and LCL = 0.The control chart shows that the process is in control. 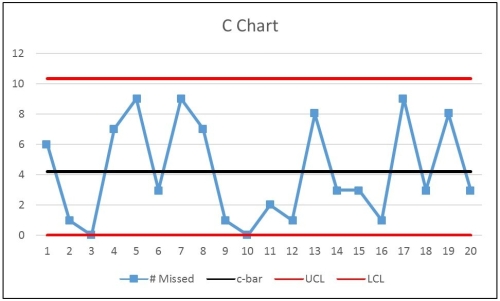
A company has been receiving complaints about the attitude of some sales clerks.Over a 10-day period, the total number of complaints was 250.The company wishes to develop a control chart for the number of complaints.What would the lower control limit on the number of complaints per day be for a 3 sigma (99.7%)control chart?
(Multiple Choice)
4.9/5 (40)
A c-chart is based on which of the following probability distributions?
(Multiple Choice)
4.9/5 (35)
Which of the following is not a popular definition of quality?
(Multiple Choice)
4.8/5 (38)
For data that are appropriately handled by C-charts, the mean equals the variance.
(True/False)
4.8/5 (41)
Explain the difference between control charts for variables and attributes.
(Essay)
4.7/5 (34)
When receiving a shipment from a supplier, inspection must be done to check the fraction of defective products.This is best monitored by which of the following control charts?
(Multiple Choice)
4.9/5 (29)
Which of these patterns on a control chart would require a worker to stop the process and investigate for an assignable cause?
(Multiple Choice)
4.8/5 (35)
Table 15-1
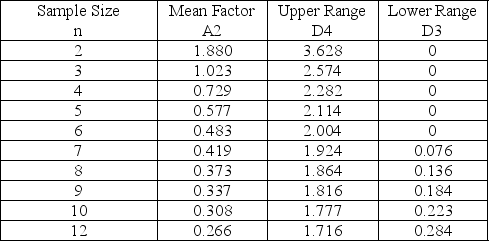 -Refer to Table 15-1.The average range of a process for packaging cereal is 1.1 ounces.If the sample size is 10, find the upper control chart limit for the range chart.
(Multiple Choice)
4.8/5 (33)
Technically, to achieve Six Sigma quality, there would have to be fewer than 3.4 defects per million opportunities.
(True/False)
4.9/5 (40)
Joe studied his control chart and noticed it had been built with repeated samples of ten units and three sigma limits that were UCL = 109.0125 and LCL = 90.9875.What is the process standard deviation?
(Multiple Choice)
5.0/5 (39)
C-charts are used to analyze the proportion defective in a sample.
(True/False)
4.7/5 (41)
TQM emphasizes quality of the goods or service-producing division of the company.
(True/False)
4.8/5 (33)
If all of the control points on a control chart lie between the UCL and the LCL, the process is always in control.
(True/False)
4.7/5 (32)
A quality control program is being developed for batteries.The percent defective for these in the past has been 3%.If a sample size of 120 is taken, what would the 99.7% upper control chart limit be?
(Multiple Choice)
4.8/5 (32)
A company has been receiving complaints about the attitude of some sales clerks.Over a 10-day period, the total number of complaints was 360.The company wishes to develop a control chart for the number of complaints.What would the upper control limit on the number of complaints per day be for a 3 sigma (99.7%)control chart?
(Multiple Choice)
5.0/5 (43)
Filters
- Essay(0)
- Multiple Choice(0)
- Short Answer(0)
- True False(0)
- Matching(0)