Deck 10: Decision Models With Uncertainty and Risk
Full screen (f)
Question
Question
Question
Question
For the below given data,Reuben wanted to accomplish a Monte Carlo simulation to study the effect of variation in unit variable cost on the final decision.While using the data table function in Excel,which cell should he reference to in the Column Input Cell field of the Data Table dialog? 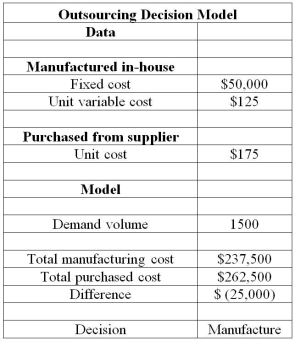
A)He can enter any cell reference that has a pre-defined formula in it.
B)He should enter the cell reference that contains the demand volume.
C)He should enter the cell reference that contains the "if formula."
D)He can enter any blank cell in the spreadsheet.
A)He can enter any cell reference that has a pre-defined formula in it.
B)He should enter the cell reference that contains the demand volume.
C)He should enter the cell reference that contains the "if formula."
D)He can enter any blank cell in the spreadsheet.
Question
Question
Question
Use the data shown below to answer the following question(s).
Captain Jack Automobiles launched a new car and tabulated the below data for the new launch. The project manager identified the following distributions and parameters for these variables:
Market size: normal with a mean of 2,000,000 units and a standard deviation of 400,000 units
R&D costs: uniform between $639,000,000 and $781,000,000
Test Drives: lognormal with mean of $160,000,000 and standard deviation $16,000,000
Annual market growth factor: triangular with minimum = 2%,maximum = 6%,and most likely = 3%
Annual market share growth rate: triangular with minimum = 15%,maximum = 25%,and most likely = 20%
Use 5,000 trials to generate the simulation model using Crystal Ball.
The individual using Crystal Ball to simulate the given data should treat the cell containing the value of market size as a(n)________.
A)forecast
B)decision
C)assumption
D)run preference
Captain Jack Automobiles launched a new car and tabulated the below data for the new launch.
The project manager identified the following distributions and parameters for these variables:Market size: normal with a mean of 2,000,000 units and a standard deviation of 400,000 units
R&D costs: uniform between $639,000,000 and $781,000,000
Test Drives: lognormal with mean of $160,000,000 and standard deviation $16,000,000
Annual market growth factor: triangular with minimum = 2%,maximum = 6%,and most likely = 3%
Annual market share growth rate: triangular with minimum = 15%,maximum = 25%,and most likely = 20%
Use 5,000 trials to generate the simulation model using Crystal Ball.
The individual using Crystal Ball to simulate the given data should treat the cell containing the value of market size as a(n)________.
A)forecast
B)decision
C)assumption
D)run preference
Question
Use the data shown below to answer the following question(s).
Captain Jack Automobiles launched a new car and tabulated the below data for the new launch. The project manager identified the following distributions and parameters for these variables:
Market size: normal with a mean of 2,000,000 units and a standard deviation of 400,000 units
R&D costs: uniform between $639,000,000 and $781,000,000
Test Drives: lognormal with mean of $160,000,000 and standard deviation $16,000,000
Annual market growth factor: triangular with minimum = 2%,maximum = 6%,and most likely = 3%
Annual market share growth rate: triangular with minimum = 15%,maximum = 25%,and most likely = 20%
Use 5,000 trials to generate the simulation model using Crystal Ball.
In the NPV forecast chart generated after running the simulation,you enter the number 0 in the left range box of the forecast chart and press the enter key.What exactly is the result of the above action?
A)It determines the percentage of risk that the NPV over the five years will not be positive.
B)It determines the probability of a positive NPV value.
C)It determines the cumulative profit over the five year range.
D)It determines the number of trials shown in the NPV forecast chart.
Captain Jack Automobiles launched a new car and tabulated the below data for the new launch.
The project manager identified the following distributions and parameters for these variables:Market size: normal with a mean of 2,000,000 units and a standard deviation of 400,000 units
R&D costs: uniform between $639,000,000 and $781,000,000
Test Drives: lognormal with mean of $160,000,000 and standard deviation $16,000,000
Annual market growth factor: triangular with minimum = 2%,maximum = 6%,and most likely = 3%
Annual market share growth rate: triangular with minimum = 15%,maximum = 25%,and most likely = 20%
Use 5,000 trials to generate the simulation model using Crystal Ball.
In the NPV forecast chart generated after running the simulation,you enter the number 0 in the left range box of the forecast chart and press the enter key.What exactly is the result of the above action?
A)It determines the percentage of risk that the NPV over the five years will not be positive.
B)It determines the probability of a positive NPV value.
C)It determines the cumulative profit over the five year range.
D)It determines the number of trials shown in the NPV forecast chart.
Question
Use the data shown below to answer the following question(s).
Captain Jack Automobiles launched a new car and tabulated the below data for the new launch. The project manager identified the following distributions and parameters for these variables:
Market size: normal with a mean of 2,000,000 units and a standard deviation of 400,000 units
R&D costs: uniform between $639,000,000 and $781,000,000
Test Drives: lognormal with mean of $160,000,000 and standard deviation $16,000,000
Annual market growth factor: triangular with minimum = 2%,maximum = 6%,and most likely = 3%
Annual market share growth rate: triangular with minimum = 15%,maximum = 25%,and most likely = 20%
Use 5,000 trials to generate the simulation model using Crystal Ball.
In the NPV forecast chart generated after running the simulation,you enter the number 0 in the right range box of the forecast chart and press the enter key.What exactly is the result of the above action?
A)The percentage of risk that the NPV over the five years will not be positive is determined.
B)The cumulative profit over the five year range is determined.
C)It determines the number of trials to be specified in the Run Preferences item of the Run group.
D)It determines the number of trials shown in the NPV forecast chart.
Captain Jack Automobiles launched a new car and tabulated the below data for the new launch.
The project manager identified the following distributions and parameters for these variables:Market size: normal with a mean of 2,000,000 units and a standard deviation of 400,000 units
R&D costs: uniform between $639,000,000 and $781,000,000
Test Drives: lognormal with mean of $160,000,000 and standard deviation $16,000,000
Annual market growth factor: triangular with minimum = 2%,maximum = 6%,and most likely = 3%
Annual market share growth rate: triangular with minimum = 15%,maximum = 25%,and most likely = 20%
Use 5,000 trials to generate the simulation model using Crystal Ball.
In the NPV forecast chart generated after running the simulation,you enter the number 0 in the right range box of the forecast chart and press the enter key.What exactly is the result of the above action?
A)The percentage of risk that the NPV over the five years will not be positive is determined.
B)The cumulative profit over the five year range is determined.
C)It determines the number of trials to be specified in the Run Preferences item of the Run group.
D)It determines the number of trials shown in the NPV forecast chart.
Question
Question
Question
Use the data shown below to answer the following question(s).
Captain Jack Automobiles launched a new car and tabulated the below data for the new launch. The project manager identified the following distributions and parameters for these variables:
Market size: normal with a mean of 2,000,000 units and a standard deviation of 400,000 units
R&D costs: uniform between $639,000,000 and $781,000,000
Test Drives: lognormal with mean of $160,000,000 and standard deviation $16,000,000
Annual market growth factor: triangular with minimum = 2%,maximum = 6%,and most likely = 3%
Annual market share growth rate: triangular with minimum = 15%,maximum = 25%,and most likely = 20%
Use 5,000 trials to generate the simulation model using Crystal Ball.
The NPV to be generated from the data given above is called a(n)________.
A)decision cell
B)assumption cell
C)bootstrap cell
D)forecast cell
Captain Jack Automobiles launched a new car and tabulated the below data for the new launch.
The project manager identified the following distributions and parameters for these variables:Market size: normal with a mean of 2,000,000 units and a standard deviation of 400,000 units
R&D costs: uniform between $639,000,000 and $781,000,000
Test Drives: lognormal with mean of $160,000,000 and standard deviation $16,000,000
Annual market growth factor: triangular with minimum = 2%,maximum = 6%,and most likely = 3%
Annual market share growth rate: triangular with minimum = 15%,maximum = 25%,and most likely = 20%
Use 5,000 trials to generate the simulation model using Crystal Ball.
The NPV to be generated from the data given above is called a(n)________.
A)decision cell
B)assumption cell
C)bootstrap cell
D)forecast cell
Question
Question
Question
Question
Question
Question
Use the data shown below to answer the following question(s).
Captain Jack Automobiles launched a new car and tabulated the below data for the new launch. The project manager identified the following distributions and parameters for these variables:
Market size: normal with a mean of 2,000,000 units and a standard deviation of 400,000 units
R&D costs: uniform between $639,000,000 and $781,000,000
Test Drives: lognormal with mean of $160,000,000 and standard deviation $16,000,000
Annual market growth factor: triangular with minimum = 2%,maximum = 6%,and most likely = 3%
Annual market share growth rate: triangular with minimum = 15%,maximum = 25%,and most likely = 20%
Use 5,000 trials to generate the simulation model using Crystal Ball.
For the given data set,what is the approximate percentage of risk that the NPV over the five years will not be positive?
A)31%
B)0%
C)68%
D)99%
Captain Jack Automobiles launched a new car and tabulated the below data for the new launch.
The project manager identified the following distributions and parameters for these variables:Market size: normal with a mean of 2,000,000 units and a standard deviation of 400,000 units
R&D costs: uniform between $639,000,000 and $781,000,000
Test Drives: lognormal with mean of $160,000,000 and standard deviation $16,000,000
Annual market growth factor: triangular with minimum = 2%,maximum = 6%,and most likely = 3%
Annual market share growth rate: triangular with minimum = 15%,maximum = 25%,and most likely = 20%
Use 5,000 trials to generate the simulation model using Crystal Ball.
For the given data set,what is the approximate percentage of risk that the NPV over the five years will not be positive?
A)31%
B)0%
C)68%
D)99%
Question
Question
Question
Question
Question
Question
Use the data set shown below to answer the following question(s). 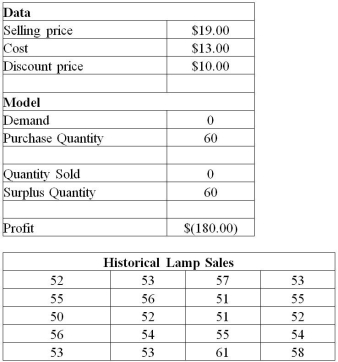
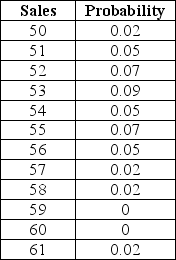 For this Newsvendor model,fit a distribution with Crystal Ball and use the Decision Table tool for analysis.Use 5,000 trials for the simulation.
For the given Newsvendor model,which of the following is defined as the decision variable?
A)Demand with lower bound 50 and upper bound 60
B)Purchase quantity with lower bound 50 and upper bound 60
C)Surplus quantity with lower bound 50 and upper bound 60
D)Profit with lower bound 50 and upper bound 60
For this Newsvendor model,fit a distribution with Crystal Ball and use the Decision Table tool for analysis.Use 5,000 trials for the simulation.For the given Newsvendor model,which of the following is defined as the decision variable?
A)Demand with lower bound 50 and upper bound 60
B)Purchase quantity with lower bound 50 and upper bound 60
C)Surplus quantity with lower bound 50 and upper bound 60
D)Profit with lower bound 50 and upper bound 60
Question
Question
Question
Question
Question
Question
Question
Question
Question
Question
Question
Question
Question
Question
Question
Question
Question
Use the data set shown below to answer the following question(s). 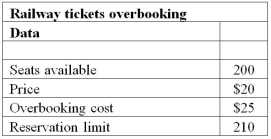 The demand at the ticket booking center can be modeled by a Poisson distribution with a mean of 220.Assume that each reservation has a constant probability of p = 0.02 of being cancelled.Use Crystal Ball functions for the model.
For the data given above,the number of reservations made is obtained using the formula ________.
A)MIN(Reservation limit,Customer demand)
B)Seats available - Reservation limit
C)Price + Overbooking cost
D)MAX(0,Customer demand)
The demand at the ticket booking center can be modeled by a Poisson distribution with a mean of 220.Assume that each reservation has a constant probability of p = 0.02 of being cancelled.Use Crystal Ball functions for the model.For the data given above,the number of reservations made is obtained using the formula ________.
A)MIN(Reservation limit,Customer demand)
B)Seats available - Reservation limit
C)Price + Overbooking cost
D)MAX(0,Customer demand)
Question
Question
Use the data set shown below to answer the following question(s). For this Newsvendor model,fit a distribution with Crystal Ball and use the Decision Table tool for analysis.Use 5,000 trials for the simulation.
Using Crystal Ball for the data set shown above,identify the purchase quantity that provides the largest average profit.
A)Purchase quantity 54
B)Purchase quantity 53
C)Purchase quantity 56
D)Purchase quantity 60
For this Newsvendor model,fit a distribution with Crystal Ball and use the Decision Table tool for analysis.Use 5,000 trials for the simulation.Using Crystal Ball for the data set shown above,identify the purchase quantity that provides the largest average profit.
A)Purchase quantity 54
B)Purchase quantity 53
C)Purchase quantity 56
D)Purchase quantity 60
Question
Question
Use the data set shown below to answer the following question(s). The demand at the ticket booking center can be modeled by a Poisson distribution with a mean of 220.Assume that each reservation has a constant probability of p = 0.02 of being cancelled.Use Crystal Ball functions for the model.
For the data given above,what is the approximate net revenue of the ticket booking counter?
A)about $2,800
B)about $3,900
C)about $4,800
D)about $5,900
The demand at the ticket booking center can be modeled by a Poisson distribution with a mean of 220.Assume that each reservation has a constant probability of p = 0.02 of being cancelled.Use Crystal Ball functions for the model.For the data given above,what is the approximate net revenue of the ticket booking counter?
A)about $2,800
B)about $3,900
C)about $4,800
D)about $5,900
Question
Use the data set shown below to answer the following question(s). The demand at the ticket booking center can be modeled by a Poisson distribution with a mean of 220.Assume that each reservation has a constant probability of p = 0.02 of being cancelled.Use Crystal Ball functions for the model.
For the data given above,identify the Crystal Ball function that models the number of cancellations.
A)CB.Poisson(0.02,Reservation limit)
B)CB.Binomial(0.02,Reservation limit)
C)CB.Poisson(0.02,Customer demand)
D)CB.Binomial(0.02,Reservations made)
The demand at the ticket booking center can be modeled by a Poisson distribution with a mean of 220.Assume that each reservation has a constant probability of p = 0.02 of being cancelled.Use Crystal Ball functions for the model.For the data given above,identify the Crystal Ball function that models the number of cancellations.
A)CB.Poisson(0.02,Reservation limit)
B)CB.Binomial(0.02,Reservation limit)
C)CB.Poisson(0.02,Customer demand)
D)CB.Binomial(0.02,Reservations made)
Question
Use the data shown below to answer the following question(s).
Captain Jack Automobiles launched a new car and tabulated the below data for the new launch.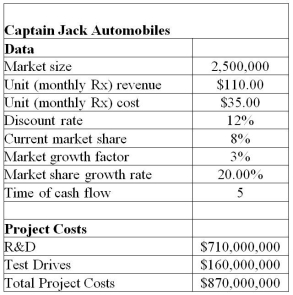 The project manager identified the following distributions and parameters for these variables:
Market size: normal with a mean of 2,000,000 units and a standard deviation of 400,000 units
R&D costs: uniform between $639,000,000 and $781,000,000
Test Drives: lognormal with mean of $160,000,000 and standard deviation $16,000,000
Annual market growth factor: triangular with minimum = 2%,maximum = 6%,and most likely = 3%
Annual market share growth rate: triangular with minimum = 15%,maximum = 25%,and most likely = 20%
Use 5,000 trails to generate the simulation model for NPV using Crystal Ball.
Using the Tornado Chart tool,determine the assumption that has the least impact on the cumulative net profit for year 1.
A)Market size
B)R&D
C)Test Drives
D)Time of cash flow
Captain Jack Automobiles launched a new car and tabulated the below data for the new launch.
The project manager identified the following distributions and parameters for these variables:Market size: normal with a mean of 2,000,000 units and a standard deviation of 400,000 units
R&D costs: uniform between $639,000,000 and $781,000,000
Test Drives: lognormal with mean of $160,000,000 and standard deviation $16,000,000
Annual market growth factor: triangular with minimum = 2%,maximum = 6%,and most likely = 3%
Annual market share growth rate: triangular with minimum = 15%,maximum = 25%,and most likely = 20%
Use 5,000 trails to generate the simulation model for NPV using Crystal Ball.
Using the Tornado Chart tool,determine the assumption that has the least impact on the cumulative net profit for year 1.
A)Market size
B)R&D
C)Test Drives
D)Time of cash flow
Question
Question
Question
Use the data set shown below to answer the following question(s). For this Newsvendor model,fit a distribution with Crystal Ball and use the Decision Table tool for analysis.Use 5,000 trials for the simulation.
For the above given data,the Decision Table tool will run a simulation for each of the ________ decision variable values defined.
A)20
B)12
C)11
D)10
For this Newsvendor model,fit a distribution with Crystal Ball and use the Decision Table tool for analysis.Use 5,000 trials for the simulation.For the above given data,the Decision Table tool will run a simulation for each of the ________ decision variable values defined.
A)20
B)12
C)11
D)10
Question
Question
Use the data set shown below to answer the following question(s). The demand at the ticket booking center can be modeled by a Poisson distribution with a mean of 220.Assume that each reservation has a constant probability of p = 0.02 of being cancelled.Use Crystal Ball functions for the model.
For the data given above,which of the following Crystal Ball functions determines the customer demand?
A)CB.Binomial(220)
B)CB.Binomial(0.02,210)
C)CB.Poisson(220)
D)CB.Poisson(0.02,220)
The demand at the ticket booking center can be modeled by a Poisson distribution with a mean of 220.Assume that each reservation has a constant probability of p = 0.02 of being cancelled.Use Crystal Ball functions for the model.For the data given above,which of the following Crystal Ball functions determines the customer demand?
A)CB.Binomial(220)
B)CB.Binomial(0.02,210)
C)CB.Poisson(220)
D)CB.Poisson(0.02,220)
Question
Question
Use the data shown below to answer the following question(s).
Captain Jack Automobiles launched a new car and tabulated the below data for the new launch. The project manager identified the following distributions and parameters for these variables:
Market size: normal with a mean of 2,000,000 units and a standard deviation of 400,000 units
R&D costs: uniform between $639,000,000 and $781,000,000
Test Drives: lognormal with mean of $160,000,000 and standard deviation $16,000,000
Annual market growth factor: triangular with minimum = 2%,maximum = 6%,and most likely = 3%
Annual market share growth rate: triangular with minimum = 15%,maximum = 25%,and most likely = 20%
Use 5,000 trails to generate the simulation model for NPV using Crystal Ball.
Using the Tornado Chart tool,determine the assumption that has the greatest impact on the NPV.
A)Market size
B)R&D
C)Test Drives
D)Market growth factor
Captain Jack Automobiles launched a new car and tabulated the below data for the new launch.
The project manager identified the following distributions and parameters for these variables:Market size: normal with a mean of 2,000,000 units and a standard deviation of 400,000 units
R&D costs: uniform between $639,000,000 and $781,000,000
Test Drives: lognormal with mean of $160,000,000 and standard deviation $16,000,000
Annual market growth factor: triangular with minimum = 2%,maximum = 6%,and most likely = 3%
Annual market share growth rate: triangular with minimum = 15%,maximum = 25%,and most likely = 20%
Use 5,000 trails to generate the simulation model for NPV using Crystal Ball.
Using the Tornado Chart tool,determine the assumption that has the greatest impact on the NPV.
A)Market size
B)R&D
C)Test Drives
D)Market growth factor
Question
Use the data set shown below to answer the following question(s). The demand at the ticket booking center can be modeled by a Poisson distribution with a mean of 220.Assume that each reservation has a constant probability of p = 0.02 of being cancelled.Use Crystal Ball functions for the model.
For the data given above,which of the following are defined as the forecast cells to run a simulation?
A)Customer demand and Reservation limit
B)Overbooked customers and Net revenue
C)Reservations made and Cancellations
D)Customer arrivals and Seats available
The demand at the ticket booking center can be modeled by a Poisson distribution with a mean of 220.Assume that each reservation has a constant probability of p = 0.02 of being cancelled.Use Crystal Ball functions for the model.For the data given above,which of the following are defined as the forecast cells to run a simulation?
A)Customer demand and Reservation limit
B)Overbooked customers and Net revenue
C)Reservations made and Cancellations
D)Customer arrivals and Seats available
Question
Use the data set shown below to answer the following question(s). The demand at the ticket booking center can be modeled by a Poisson distribution with a mean of 220.Assume that each reservation has a constant probability of p = 0.02 of being cancelled.Use Crystal Ball functions for the model.
Using the above data,the number of overbooked customers is computed using ________.
A)MAX(Customer arrivals,Seats available)
B)MIN(0,Customer arrivals - Seats available)
C)MAX(0,Customer arrivals - Seats available)
D)MIN(Customer arrivals,Seats available)
The demand at the ticket booking center can be modeled by a Poisson distribution with a mean of 220.Assume that each reservation has a constant probability of p = 0.02 of being cancelled.Use Crystal Ball functions for the model.Using the above data,the number of overbooked customers is computed using ________.
A)MAX(Customer arrivals,Seats available)
B)MIN(0,Customer arrivals - Seats available)
C)MAX(0,Customer arrivals - Seats available)
D)MIN(Customer arrivals,Seats available)
Question
Use the data set shown below to answer the following question(s). The demand at the ticket booking center can be modeled by a Poisson distribution with a mean of 220.Assume that each reservation has a constant probability of p = 0.02 of being cancelled.Use Crystal Ball functions for the model.
For the data given above,which of the following calculates the number of customer arrivals?
A)Reservation limit - Reservations made
B)Reservation limit - Cancellations
C)Cancellations + Reservations made
D)Reservations made - Cancellations
The demand at the ticket booking center can be modeled by a Poisson distribution with a mean of 220.Assume that each reservation has a constant probability of p = 0.02 of being cancelled.Use Crystal Ball functions for the model.For the data given above,which of the following calculates the number of customer arrivals?
A)Reservation limit - Reservations made
B)Reservation limit - Cancellations
C)Cancellations + Reservations made
D)Reservations made - Cancellations
Question
Question
Use the data set shown below to answer the following question(s). For this Newsvendor model,fit a distribution with Crystal Ball and use the Decision Table tool for analysis.Use 5,000 trials for the simulation.
Which of the following provides the lowest average profit?
A)Purchase quantity 57
B)Purchase quantity 58
C)Purchase quantity 59
D)Purchase quantity 60
For this Newsvendor model,fit a distribution with Crystal Ball and use the Decision Table tool for analysis.Use 5,000 trials for the simulation.Which of the following provides the lowest average profit?
A)Purchase quantity 57
B)Purchase quantity 58
C)Purchase quantity 59
D)Purchase quantity 60
Question
Use the data shown below to answer the following question(s).
Captain Jack Automobiles launched a new car and tabulated the below data for the new launch. The project manager identified the following distributions and parameters for these variables:
Market size: normal with a mean of 2,000,000 units and a standard deviation of 400,000 units
R&D costs: uniform between $639,000,000 and $781,000,000
Test Drives: lognormal with mean of $160,000,000 and standard deviation $16,000,000
Annual market growth factor: triangular with minimum = 2%,maximum = 6%,and most likely = 3%
Annual market share growth rate: triangular with minimum = 15%,maximum = 25%,and most likely = 20%
Use 5,000 trails to generate the simulation model for NPV using Crystal Ball.
Using the Tornado Chart tool,determine the assumption that has the least impact on the NPV.
A)Market size
B)R&D
C)Test Drives
D)Time of cash flow
Captain Jack Automobiles launched a new car and tabulated the below data for the new launch.
The project manager identified the following distributions and parameters for these variables:Market size: normal with a mean of 2,000,000 units and a standard deviation of 400,000 units
R&D costs: uniform between $639,000,000 and $781,000,000
Test Drives: lognormal with mean of $160,000,000 and standard deviation $16,000,000
Annual market growth factor: triangular with minimum = 2%,maximum = 6%,and most likely = 3%
Annual market share growth rate: triangular with minimum = 15%,maximum = 25%,and most likely = 20%
Use 5,000 trails to generate the simulation model for NPV using Crystal Ball.
Using the Tornado Chart tool,determine the assumption that has the least impact on the NPV.
A)Market size
B)R&D
C)Test Drives
D)Time of cash flow
Question
Question
Question
Question
Question
Question
Question
Question
Question
Question
Question
Question
Question
Question
Question
Question
Question
Question
Question
Question

Unlock Deck
Sign up to unlock the cards in this deck!
Unlock Deck
Unlock Deck
1/90
Play
Full screen (f)
Deck 10: Decision Models With Uncertainty and Risk
1
In a forecast chart provided by Crystal Ball for the cumulative net profit of a particular year,you intend to find the chances that the forecast value will show a cumulative profit in that particular year.In this scenario,you should ________.
A)enter the number 0 into the left range box of the forecast chart and press the enter key
B)enter the number 0 in the right range box of the forecast chart and press the enter key
C)first anchor the right grabber at infinity and then enter 0 in the Certainty box
D)first anchor the left grabber at infinity and then enter 0 in the Certainty box
enter the number 0 into the left range box of the forecast chart and press the enter key
2
In a forecast chart provided by Crystal Ball,a certainty level is ________.
A)a probability interval that states the probability of the forecast falling within the specified range of the grabbers
B)the number of trials displayed on the forecast chart
C)the number of trials specified in the Trials Tab contained in the Run Preferences item of the Run group
D)a number that specifies the count of assumptions defined before running the simulation
a probability interval that states the probability of the forecast falling within the specified range of the grabbers
3
An individual using Crystal Ball can choose to use the same sequence of random numbers for generating the random variates in the assumption cells.The above mentioned function can be found in the ________.
A)Sampling Tab in the Run Preferences item
B)Custom distribution from the Assumptions item
C)Define Decision option on the main ribbon
D)Define Forecast option on the main ribbon
A)Sampling Tab in the Run Preferences item
B)Custom distribution from the Assumptions item
C)Define Decision option on the main ribbon
D)Define Forecast option on the main ribbon
Sampling Tab in the Run Preferences item
4
For the below given data,Reuben wanted to accomplish a Monte Carlo simulation to study the effect of variation in unit variable cost on the final decision.While using the data table function in Excel,which cell should he reference to in the Column Input Cell field of the Data Table dialog?
A)He can enter any cell reference that has a pre-defined formula in it.
B)He should enter the cell reference that contains the demand volume.
C)He should enter the cell reference that contains the "if formula."
D)He can enter any blank cell in the spreadsheet.
A)He can enter any cell reference that has a pre-defined formula in it.
B)He should enter the cell reference that contains the demand volume.
C)He should enter the cell reference that contains the "if formula."
D)He can enter any blank cell in the spreadsheet.
Unlock Deck
Unlock for access to all 90 flashcards in this deck.
Unlock Deck
k this deck
5
In a forecast chart provided by Crystal Ball,you intend to find the percentage of risk that the forecast over the specified period of time will not be positive.In this scenario,you should ________.
A)enter the number 0 in the left range box of the forecast chart and press the enter key
B)enter the number 0 in the right range box of the forecast chart and press the enter key
C)first anchor the right grabber at infinity and then enter 0 in the Certainty box
D)first anchor the left grabber at infinity and then enter 0 in the Certainty box
Unlock Deck
Unlock for access to all 90 flashcards in this deck.
Unlock Deck
k this deck
6
In a forecast chart provided by Crystal Ball,you intend to find the probability of a positive forecast value.In this scenario,you should ________.
A)enter the number 0 into the left range box of the forecast chart and press the enter key
B)enter the number 0 in the right range box of the forecast chart and press the enter key
C)first anchor the right grabber at infinity and then enter 0 in the Certainty box
D)first anchor the left grabber at infinity and then enter 0 in the Certainty box
Unlock Deck
Unlock for access to all 90 flashcards in this deck.
Unlock Deck
k this deck
7
Use the data shown below to answer the following question(s).
Captain Jack Automobiles launched a new car and tabulated the below data for the new launch. The project manager identified the following distributions and parameters for these variables:
Market size: normal with a mean of 2,000,000 units and a standard deviation of 400,000 units
R&D costs: uniform between $639,000,000 and $781,000,000
Test Drives: lognormal with mean of $160,000,000 and standard deviation $16,000,000
Annual market growth factor: triangular with minimum = 2%,maximum = 6%,and most likely = 3%
Annual market share growth rate: triangular with minimum = 15%,maximum = 25%,and most likely = 20%
Use 5,000 trials to generate the simulation model using Crystal Ball.
The individual using Crystal Ball to simulate the given data should treat the cell containing the value of market size as a(n)________.
A)forecast
B)decision
C)assumption
D)run preference
Captain Jack Automobiles launched a new car and tabulated the below data for the new launch.
The project manager identified the following distributions and parameters for these variables:Market size: normal with a mean of 2,000,000 units and a standard deviation of 400,000 units
R&D costs: uniform between $639,000,000 and $781,000,000
Test Drives: lognormal with mean of $160,000,000 and standard deviation $16,000,000
Annual market growth factor: triangular with minimum = 2%,maximum = 6%,and most likely = 3%
Annual market share growth rate: triangular with minimum = 15%,maximum = 25%,and most likely = 20%
Use 5,000 trials to generate the simulation model using Crystal Ball.
The individual using Crystal Ball to simulate the given data should treat the cell containing the value of market size as a(n)________.
A)forecast
B)decision
C)assumption
D)run preference
Unlock Deck
Unlock for access to all 90 flashcards in this deck.
Unlock Deck
k this deck
8
Use the data shown below to answer the following question(s).
Captain Jack Automobiles launched a new car and tabulated the below data for the new launch. The project manager identified the following distributions and parameters for these variables:
Market size: normal with a mean of 2,000,000 units and a standard deviation of 400,000 units
R&D costs: uniform between $639,000,000 and $781,000,000
Test Drives: lognormal with mean of $160,000,000 and standard deviation $16,000,000
Annual market growth factor: triangular with minimum = 2%,maximum = 6%,and most likely = 3%
Annual market share growth rate: triangular with minimum = 15%,maximum = 25%,and most likely = 20%
Use 5,000 trials to generate the simulation model using Crystal Ball.
In the NPV forecast chart generated after running the simulation,you enter the number 0 in the left range box of the forecast chart and press the enter key.What exactly is the result of the above action?
A)It determines the percentage of risk that the NPV over the five years will not be positive.
B)It determines the probability of a positive NPV value.
C)It determines the cumulative profit over the five year range.
D)It determines the number of trials shown in the NPV forecast chart.
Captain Jack Automobiles launched a new car and tabulated the below data for the new launch.
The project manager identified the following distributions and parameters for these variables:Market size: normal with a mean of 2,000,000 units and a standard deviation of 400,000 units
R&D costs: uniform between $639,000,000 and $781,000,000
Test Drives: lognormal with mean of $160,000,000 and standard deviation $16,000,000
Annual market growth factor: triangular with minimum = 2%,maximum = 6%,and most likely = 3%
Annual market share growth rate: triangular with minimum = 15%,maximum = 25%,and most likely = 20%
Use 5,000 trials to generate the simulation model using Crystal Ball.
In the NPV forecast chart generated after running the simulation,you enter the number 0 in the left range box of the forecast chart and press the enter key.What exactly is the result of the above action?
A)It determines the percentage of risk that the NPV over the five years will not be positive.
B)It determines the probability of a positive NPV value.
C)It determines the cumulative profit over the five year range.
D)It determines the number of trials shown in the NPV forecast chart.
Unlock Deck
Unlock for access to all 90 flashcards in this deck.
Unlock Deck
k this deck
9
Use the data shown below to answer the following question(s).
Captain Jack Automobiles launched a new car and tabulated the below data for the new launch. The project manager identified the following distributions and parameters for these variables:
Market size: normal with a mean of 2,000,000 units and a standard deviation of 400,000 units
R&D costs: uniform between $639,000,000 and $781,000,000
Test Drives: lognormal with mean of $160,000,000 and standard deviation $16,000,000
Annual market growth factor: triangular with minimum = 2%,maximum = 6%,and most likely = 3%
Annual market share growth rate: triangular with minimum = 15%,maximum = 25%,and most likely = 20%
Use 5,000 trials to generate the simulation model using Crystal Ball.
In the NPV forecast chart generated after running the simulation,you enter the number 0 in the right range box of the forecast chart and press the enter key.What exactly is the result of the above action?
A)The percentage of risk that the NPV over the five years will not be positive is determined.
B)The cumulative profit over the five year range is determined.
C)It determines the number of trials to be specified in the Run Preferences item of the Run group.
D)It determines the number of trials shown in the NPV forecast chart.
Captain Jack Automobiles launched a new car and tabulated the below data for the new launch.
The project manager identified the following distributions and parameters for these variables:Market size: normal with a mean of 2,000,000 units and a standard deviation of 400,000 units
R&D costs: uniform between $639,000,000 and $781,000,000
Test Drives: lognormal with mean of $160,000,000 and standard deviation $16,000,000
Annual market growth factor: triangular with minimum = 2%,maximum = 6%,and most likely = 3%
Annual market share growth rate: triangular with minimum = 15%,maximum = 25%,and most likely = 20%
Use 5,000 trials to generate the simulation model using Crystal Ball.
In the NPV forecast chart generated after running the simulation,you enter the number 0 in the right range box of the forecast chart and press the enter key.What exactly is the result of the above action?
A)The percentage of risk that the NPV over the five years will not be positive is determined.
B)The cumulative profit over the five year range is determined.
C)It determines the number of trials to be specified in the Run Preferences item of the Run group.
D)It determines the number of trials shown in the NPV forecast chart.
Unlock Deck
Unlock for access to all 90 flashcards in this deck.
Unlock Deck
k this deck
10
________ is the probability of occurrence of an undesirable outcome.
A)Simulation
B)Risk
C)A certainty level
D)Run
A)Simulation
B)Risk
C)A certainty level
D)Run
Unlock Deck
Unlock for access to all 90 flashcards in this deck.
Unlock Deck
k this deck
11
The Sampling tab of Crystal Ball is useful when you wish to ________.
A)prescreen the variables in order to determine which variables are the most important candidates to define as assumptions before building a simulation model
B)use the correlation coefficients in order to rearrange the generated random variates to produce the desired correlations
C)define the assumptions for the variables in the data set
D)define a controllable variable in your model and compare results for the same assumption values
Unlock Deck
Unlock for access to all 90 flashcards in this deck.
Unlock Deck
k this deck
12
Use the data shown below to answer the following question(s).
Captain Jack Automobiles launched a new car and tabulated the below data for the new launch. The project manager identified the following distributions and parameters for these variables:
Market size: normal with a mean of 2,000,000 units and a standard deviation of 400,000 units
R&D costs: uniform between $639,000,000 and $781,000,000
Test Drives: lognormal with mean of $160,000,000 and standard deviation $16,000,000
Annual market growth factor: triangular with minimum = 2%,maximum = 6%,and most likely = 3%
Annual market share growth rate: triangular with minimum = 15%,maximum = 25%,and most likely = 20%
Use 5,000 trials to generate the simulation model using Crystal Ball.
The NPV to be generated from the data given above is called a(n)________.
A)decision cell
B)assumption cell
C)bootstrap cell
D)forecast cell
Captain Jack Automobiles launched a new car and tabulated the below data for the new launch.
The project manager identified the following distributions and parameters for these variables:Market size: normal with a mean of 2,000,000 units and a standard deviation of 400,000 units
R&D costs: uniform between $639,000,000 and $781,000,000
Test Drives: lognormal with mean of $160,000,000 and standard deviation $16,000,000
Annual market growth factor: triangular with minimum = 2%,maximum = 6%,and most likely = 3%
Annual market share growth rate: triangular with minimum = 15%,maximum = 25%,and most likely = 20%
Use 5,000 trials to generate the simulation model using Crystal Ball.
The NPV to be generated from the data given above is called a(n)________.
A)decision cell
B)assumption cell
C)bootstrap cell
D)forecast cell
Unlock Deck
Unlock for access to all 90 flashcards in this deck.
Unlock Deck
k this deck
13
Which of the following contains the Trials Tab that allows an individual to choose the number of times that Crystal Ball generates assumptions for the assumption cells in the model and recalculates the entire spreadsheet?
A)the Correlation matrix in the More Tools group
B)the Run preferences item from the Run group
C)the Custom item from the Assumptions group
D)the Cell Preferences tab on the main ribbon
A)the Correlation matrix in the More Tools group
B)the Run preferences item from the Run group
C)the Custom item from the Assumptions group
D)the Cell Preferences tab on the main ribbon
Unlock Deck
Unlock for access to all 90 flashcards in this deck.
Unlock Deck
k this deck
14
Latin Hypercube sampling differs from Monte Carlo Sampling in that Latin Hypercube sampling ________.
A)selects random variates independently over the entire range of possible values
B)is a part of the Crystal Ball suite
C)is more representative of reality than Monte Carlo sampling
D)results in a more even distribution of forecast values than Monte Carlo sampling
A)selects random variates independently over the entire range of possible values
B)is a part of the Crystal Ball suite
C)is more representative of reality than Monte Carlo sampling
D)results in a more even distribution of forecast values than Monte Carlo sampling
Unlock Deck
Unlock for access to all 90 flashcards in this deck.
Unlock Deck
k this deck
15
In Crystal Ball,uncertain inputs are called ________.
A)assumptions
B)decisions
C)forecasts
D)run preferences
A)assumptions
B)decisions
C)forecasts
D)run preferences
Unlock Deck
Unlock for access to all 90 flashcards in this deck.
Unlock Deck
k this deck
16
What is Monte Carlo simulation?
A)It is the process of generating random values for uncertain inputs in a model,computing the output variables of interest,and repeating this process for many trials in order to understand the distribution of the output results.
B)It is a measure of the correlation between two variables X and Y that falls exclusively between the values +1 and -1.
C)It is a ratio of the departure of an estimated parameter from its notional value and its standard error.
D)It is an approach for developing a comprehensive understanding and awareness of the risk associated with a particular variable of interest.
Unlock Deck
Unlock for access to all 90 flashcards in this deck.
Unlock Deck
k this deck
17
Monte Carlo sampling differs from Latin Hypercube sampling in that Monte Carlo sampling ________.
A)divides each assumption's probability distribution into intervals of equal probability and generates an assumption value randomly within each interval
B)results in a more even distribution of forecast values than Latin Hypercube sampling because it samples the entire range of the distribution in a more consistent manner,thus achieving more accurate forecast statistics
C)selects random variates independently over the entire range of possible values
D)is a part of the Crystal Ball suite
Unlock Deck
Unlock for access to all 90 flashcards in this deck.
Unlock Deck
k this deck
18
Use the data shown below to answer the following question(s).
Captain Jack Automobiles launched a new car and tabulated the below data for the new launch. The project manager identified the following distributions and parameters for these variables:
Market size: normal with a mean of 2,000,000 units and a standard deviation of 400,000 units
R&D costs: uniform between $639,000,000 and $781,000,000
Test Drives: lognormal with mean of $160,000,000 and standard deviation $16,000,000
Annual market growth factor: triangular with minimum = 2%,maximum = 6%,and most likely = 3%
Annual market share growth rate: triangular with minimum = 15%,maximum = 25%,and most likely = 20%
Use 5,000 trials to generate the simulation model using Crystal Ball.
For the given data set,what is the approximate percentage of risk that the NPV over the five years will not be positive?
A)31%
B)0%
C)68%
D)99%
Captain Jack Automobiles launched a new car and tabulated the below data for the new launch.
The project manager identified the following distributions and parameters for these variables:Market size: normal with a mean of 2,000,000 units and a standard deviation of 400,000 units
R&D costs: uniform between $639,000,000 and $781,000,000
Test Drives: lognormal with mean of $160,000,000 and standard deviation $16,000,000
Annual market growth factor: triangular with minimum = 2%,maximum = 6%,and most likely = 3%
Annual market share growth rate: triangular with minimum = 15%,maximum = 25%,and most likely = 20%
Use 5,000 trials to generate the simulation model using Crystal Ball.
For the given data set,what is the approximate percentage of risk that the NPV over the five years will not be positive?
A)31%
B)0%
C)68%
D)99%
Unlock Deck
Unlock for access to all 90 flashcards in this deck.
Unlock Deck
k this deck
19
In a forecast chart provided by Crystal Ball for the cumulative net profit of a particular year,you intend to find the cumulative profit for a given probability value.In this scenario,you should ________.
A)enter the probability value in the left range box of the forecast chart and press the enter key
B)enter the probability value in the right range box of the forecast chart and press the enter key
C)first anchor the right grabber at infinity and then enter the probability value in the Certainty box
D)first anchor the left grabber at infinity and then enter the probability value in the Certainty box
Unlock Deck
Unlock for access to all 90 flashcards in this deck.
Unlock Deck
k this deck
20
In Crystal Ball,forecast cells are the ________.
A)default parameters based on the current values in the spreadsheet model
B)uncertain inputs
C)output variables in which we are interested in
D)decision variables
A)default parameters based on the current values in the spreadsheet model
B)uncertain inputs
C)output variables in which we are interested in
D)decision variables
Unlock Deck
Unlock for access to all 90 flashcards in this deck.
Unlock Deck
k this deck
21
In the first year,Captain Jack Automobiles is likely to realize an approximate cumulative profit of ________ with a probability of at least 0.80.
A)$(771,541,415)
B)$(386,772,685)
C)$(685,772,386)
D)$(995,989,978)
A)$(771,541,415)
B)$(386,772,685)
C)$(685,772,386)
D)$(995,989,978)
Unlock Deck
Unlock for access to all 90 flashcards in this deck.
Unlock Deck
k this deck
22
What are the chances that Captain Jack Automobiles will show a cumulative net profit in the fourth year?
A)approximately 23.36%
B)approximately 62.04%
C)approximately 37.68%
D)approximately 76.64%
A)approximately 23.36%
B)approximately 62.04%
C)approximately 37.68%
D)approximately 76.64%
Unlock Deck
Unlock for access to all 90 flashcards in this deck.
Unlock Deck
k this deck
23
In the forecast chart for the cumulative profit in year 3,you enter the value 0 into the left range box and hit the enter button.The above set of actions determines the ________.
A)percentage of risk that the NPV in the third year will not be positive
B)percentage of risk that the NPV in the third year will be positive
C)number of trials shown in the cumulative profit forecast chart for year 3
D)probability that the product will show a cumulative net profit in the third year
Unlock Deck
Unlock for access to all 90 flashcards in this deck.
Unlock Deck
k this deck
24
Use the data set shown below to answer the following question(s). For this Newsvendor model,fit a distribution with Crystal Ball and use the Decision Table tool for analysis.Use 5,000 trials for the simulation.
For the given Newsvendor model,which of the following is defined as the decision variable?
A)Demand with lower bound 50 and upper bound 60
B)Purchase quantity with lower bound 50 and upper bound 60
C)Surplus quantity with lower bound 50 and upper bound 60
D)Profit with lower bound 50 and upper bound 60
For this Newsvendor model,fit a distribution with Crystal Ball and use the Decision Table tool for analysis.Use 5,000 trials for the simulation.For the given Newsvendor model,which of the following is defined as the decision variable?
A)Demand with lower bound 50 and upper bound 60
B)Purchase quantity with lower bound 50 and upper bound 60
C)Surplus quantity with lower bound 50 and upper bound 60
D)Profit with lower bound 50 and upper bound 60
Unlock Deck
Unlock for access to all 90 flashcards in this deck.
Unlock Deck
k this deck
25
What is bootstrapping in Crystal Ball?
A)It is a statistical tool that provides a priori sensitivity information about the impact of each model variable on a target forecast.
B)It is a statistical technique that fits probability distributions to multiple data series.
C)It is a statistical technique that analyzes sample statistics empirically by repeatedly sampling the data and creating distributions of the statistics.
D)It is a statistical tool that allows individuals to define correlations between groups of assumptions in a model.
Unlock Deck
Unlock for access to all 90 flashcards in this deck.
Unlock Deck
k this deck
26
What are the chances that Captain Jack Automobiles will show a cumulative net profit in the fifth year?
A)approximately 76%
B)approximately 99.83%
C)approximately 11.08%
D)approximately 88.92%
A)approximately 76%
B)approximately 99.83%
C)approximately 11.08%
D)approximately 88.92%
Unlock Deck
Unlock for access to all 90 flashcards in this deck.
Unlock Deck
k this deck
27
In Crystal Ball,a tornado chart differs from a sensitivity chart in that the tornado chart ________.
A)is used only for normally distributed data
B)is used only for uniformly distributed data
C)analyzes sample statistics empirically by repeatedly sampling the data and creating distributions of the statistics
D)tests each assumption independently while freezing the other variables at their base values
Unlock Deck
Unlock for access to all 90 flashcards in this deck.
Unlock Deck
k this deck
28
If a simulation has multiple related forecasts,the ________ feature in Crystal Ball allows an individual to superimpose the frequency data from selected forecasts on one chart in order to compare differences and similarities that might not be apparent.
A)Tornado Charts
B)Forecast Charts
C)Overlay Charts
D)Sensitivity Charts
A)Tornado Charts
B)Forecast Charts
C)Overlay Charts
D)Sensitivity Charts
Unlock Deck
Unlock for access to all 90 flashcards in this deck.
Unlock Deck
k this deck
29
What are the chances that Captain Jack Automobiles will show a cumulative net profit in the third year?
A)approximately 76%
B)approximately 99.83%
C)approximately 0.76%
D)approximately 0.24%
A)approximately 76%
B)approximately 99.83%
C)approximately 0.76%
D)approximately 0.24%
Unlock Deck
Unlock for access to all 90 flashcards in this deck.
Unlock Deck
k this deck
30
The Chart Bins in Crystal Ball helps in the extraction of ________.
A)the generated assumptions and forecast values for each simulation trial
B)the intervals in the forecast chart along with their probability and frequency of occurrence
C)percentiles
D)the Scatter Charts that show correlations,dependencies,and other relationships between pairs of variables plotted against each other
Unlock Deck
Unlock for access to all 90 flashcards in this deck.
Unlock Deck
k this deck
31
The ________ feature in Crystal Ball allows an individual to determine the influence that each assumption has individually on a forecast.
A)Overlay Charts
B)Tornado Charts
C)Forecast Charts
D)Sensitivity Charts
A)Overlay Charts
B)Tornado Charts
C)Forecast Charts
D)Sensitivity Charts
Unlock Deck
Unlock for access to all 90 flashcards in this deck.
Unlock Deck
k this deck
32
In the forecast chart for the cumulative net profit for year 2,you first anchor the right grabber at infinity,enter 70 in the Certainty box,and then hit the enter button.The above set of action determines the ________.
A)cumulative profit in the second year that we are likely to realize with a probability of at least 0.30
B)cumulative profit in the second year that we are likely to realize with a probability of at least 0.70
C)probability that the product will show a cumulative net profit in the second year
D)number of trials shown in the cumulative net profit forecast chart for year 2
Unlock Deck
Unlock for access to all 90 flashcards in this deck.
Unlock Deck
k this deck
33
In the third year,the company is likely to realize a cumulative net profit of $(407,199,952)with a probability of ________.
A)about 65%
B)about 75%
C)about 55%
D)about 85%
A)about 65%
B)about 75%
C)about 55%
D)about 85%
Unlock Deck
Unlock for access to all 90 flashcards in this deck.
Unlock Deck
k this deck
34
In the ________ year,Captain Jack Automobiles is likely to realize a cumulative profit of approximately $(680,000,000)with a probability of at least 0.95.
A)fourth
B)third
C)second
D)first
A)fourth
B)third
C)second
D)first
Unlock Deck
Unlock for access to all 90 flashcards in this deck.
Unlock Deck
k this deck
35
The probability of a positive cumulative net profit in the ________ year is approximately 88%.
A)fourth
B)fifth
C)third
D)second
A)fourth
B)fifth
C)third
D)second
Unlock Deck
Unlock for access to all 90 flashcards in this deck.
Unlock Deck
k this deck
36
In Crystal Ball,the ________ tool provides a priori sensitivity information about the impact of each model variable on a target forecast.
A)Tornado Chart
B)Correlation Matrix
C)Batch Fit
D)Bootstrap
A)Tornado Chart
B)Correlation Matrix
C)Batch Fit
D)Bootstrap
Unlock Deck
Unlock for access to all 90 flashcards in this deck.
Unlock Deck
k this deck
37
Determine the approximate cumulative profit that Captain Jack Automobiles is likely to realize with a probability of 0.20 in the third year.
A)$(354,197,482)
B)$(230,692,609)
C)$(295,431,274)
D)$(324,707,372)
A)$(354,197,482)
B)$(230,692,609)
C)$(295,431,274)
D)$(324,707,372)
Unlock Deck
Unlock for access to all 90 flashcards in this deck.
Unlock Deck
k this deck
38
For the given data set,the probability of a positive NPV value over the five years is ________.
A)31%
B)0%
C)68%
D)99%
A)31%
B)0%
C)68%
D)99%
Unlock Deck
Unlock for access to all 90 flashcards in this deck.
Unlock Deck
k this deck
39
The sensitivity chart displays the rankings of each assumption according to their impact on a forecast cell as a(n)________.
A)line chart
B)column chart
C)histogram
D)bar chart
A)line chart
B)column chart
C)histogram
D)bar chart
Unlock Deck
Unlock for access to all 90 flashcards in this deck.
Unlock Deck
k this deck
40
In the fourth year,Captain Jack Automobiles is likely to realize an approximate cumulative profit of ________ with a probability of at least 0.10.
A)$20,220,888
B)$164,988,214
C)$10,110,444
D)$268,539,416
A)$20,220,888
B)$164,988,214
C)$10,110,444
D)$268,539,416
Unlock Deck
Unlock for access to all 90 flashcards in this deck.
Unlock Deck
k this deck
41
Use the data set shown below to answer the following question(s). The demand at the ticket booking center can be modeled by a Poisson distribution with a mean of 220.Assume that each reservation has a constant probability of p = 0.02 of being cancelled.Use Crystal Ball functions for the model.
For the data given above,the number of reservations made is obtained using the formula ________.
A)MIN(Reservation limit,Customer demand)
B)Seats available - Reservation limit
C)Price + Overbooking cost
D)MAX(0,Customer demand)
The demand at the ticket booking center can be modeled by a Poisson distribution with a mean of 220.Assume that each reservation has a constant probability of p = 0.02 of being cancelled.Use Crystal Ball functions for the model.For the data given above,the number of reservations made is obtained using the formula ________.
A)MIN(Reservation limit,Customer demand)
B)Seats available - Reservation limit
C)Price + Overbooking cost
D)MAX(0,Customer demand)
Unlock Deck
Unlock for access to all 90 flashcards in this deck.
Unlock Deck
k this deck
42
In the data table generated along with the tornado chart,the tool examines values ________.
A)10% away from the downside and evaluates the selected forecast holding the other forecasts constant
B)12.5% away from the downside and evaluates the selected forecast holding all the other forecasts constant
C)12.5% away from the upside and evaluates the selected forecast while holding all other variables constant
D)10% away from the base case and evaluates the selected forecast while holding all other variables constant
Unlock Deck
Unlock for access to all 90 flashcards in this deck.
Unlock Deck
k this deck
43
Use the data set shown below to answer the following question(s). For this Newsvendor model,fit a distribution with Crystal Ball and use the Decision Table tool for analysis.Use 5,000 trials for the simulation.
Using Crystal Ball for the data set shown above,identify the purchase quantity that provides the largest average profit.
A)Purchase quantity 54
B)Purchase quantity 53
C)Purchase quantity 56
D)Purchase quantity 60
For this Newsvendor model,fit a distribution with Crystal Ball and use the Decision Table tool for analysis.Use 5,000 trials for the simulation.Using Crystal Ball for the data set shown above,identify the purchase quantity that provides the largest average profit.
A)Purchase quantity 54
B)Purchase quantity 53
C)Purchase quantity 56
D)Purchase quantity 60
Unlock Deck
Unlock for access to all 90 flashcards in this deck.
Unlock Deck
k this deck
44
The spider chart shows the results as rates of change; ________.
A)the larger the number of potential assumptions,the lower the impact
B)the larger the slope,the higher the impact
C)the larger the slope,the lower the impact
D)the larger the number of potential assumptions,the higher the impact
A)the larger the number of potential assumptions,the lower the impact
B)the larger the slope,the higher the impact
C)the larger the slope,the lower the impact
D)the larger the number of potential assumptions,the higher the impact
Unlock Deck
Unlock for access to all 90 flashcards in this deck.
Unlock Deck
k this deck
45
Use the data set shown below to answer the following question(s). The demand at the ticket booking center can be modeled by a Poisson distribution with a mean of 220.Assume that each reservation has a constant probability of p = 0.02 of being cancelled.Use Crystal Ball functions for the model.
For the data given above,what is the approximate net revenue of the ticket booking counter?
A)about $2,800
B)about $3,900
C)about $4,800
D)about $5,900
The demand at the ticket booking center can be modeled by a Poisson distribution with a mean of 220.Assume that each reservation has a constant probability of p = 0.02 of being cancelled.Use Crystal Ball functions for the model.For the data given above,what is the approximate net revenue of the ticket booking counter?
A)about $2,800
B)about $3,900
C)about $4,800
D)about $5,900
Unlock Deck
Unlock for access to all 90 flashcards in this deck.
Unlock Deck
k this deck
46
Use the data set shown below to answer the following question(s). The demand at the ticket booking center can be modeled by a Poisson distribution with a mean of 220.Assume that each reservation has a constant probability of p = 0.02 of being cancelled.Use Crystal Ball functions for the model.
For the data given above,identify the Crystal Ball function that models the number of cancellations.
A)CB.Poisson(0.02,Reservation limit)
B)CB.Binomial(0.02,Reservation limit)
C)CB.Poisson(0.02,Customer demand)
D)CB.Binomial(0.02,Reservations made)
The demand at the ticket booking center can be modeled by a Poisson distribution with a mean of 220.Assume that each reservation has a constant probability of p = 0.02 of being cancelled.Use Crystal Ball functions for the model.For the data given above,identify the Crystal Ball function that models the number of cancellations.
A)CB.Poisson(0.02,Reservation limit)
B)CB.Binomial(0.02,Reservation limit)
C)CB.Poisson(0.02,Customer demand)
D)CB.Binomial(0.02,Reservations made)
Unlock Deck
Unlock for access to all 90 flashcards in this deck.
Unlock Deck
k this deck
47
Use the data shown below to answer the following question(s).
Captain Jack Automobiles launched a new car and tabulated the below data for the new launch. The project manager identified the following distributions and parameters for these variables:
Market size: normal with a mean of 2,000,000 units and a standard deviation of 400,000 units
R&D costs: uniform between $639,000,000 and $781,000,000
Test Drives: lognormal with mean of $160,000,000 and standard deviation $16,000,000
Annual market growth factor: triangular with minimum = 2%,maximum = 6%,and most likely = 3%
Annual market share growth rate: triangular with minimum = 15%,maximum = 25%,and most likely = 20%
Use 5,000 trails to generate the simulation model for NPV using Crystal Ball.
Using the Tornado Chart tool,determine the assumption that has the least impact on the cumulative net profit for year 1.
A)Market size
B)R&D
C)Test Drives
D)Time of cash flow
Captain Jack Automobiles launched a new car and tabulated the below data for the new launch.
The project manager identified the following distributions and parameters for these variables:Market size: normal with a mean of 2,000,000 units and a standard deviation of 400,000 units
R&D costs: uniform between $639,000,000 and $781,000,000
Test Drives: lognormal with mean of $160,000,000 and standard deviation $16,000,000
Annual market growth factor: triangular with minimum = 2%,maximum = 6%,and most likely = 3%
Annual market share growth rate: triangular with minimum = 15%,maximum = 25%,and most likely = 20%
Use 5,000 trails to generate the simulation model for NPV using Crystal Ball.
Using the Tornado Chart tool,determine the assumption that has the least impact on the cumulative net profit for year 1.
A)Market size
B)R&D
C)Test Drives
D)Time of cash flow
Unlock Deck
Unlock for access to all 90 flashcards in this deck.
Unlock Deck
k this deck
48
When compared to the forecast without correlated assumptions,the ________ of the forecast with correlated assumptions is ________,thus providing more accuracy in the estimate.
A)correlation coefficient; larger
B)distribution; symmetric
C)distribution; skewed
D)variance; smaller
A)correlation coefficient; larger
B)distribution; symmetric
C)distribution; skewed
D)variance; smaller
Unlock Deck
Unlock for access to all 90 flashcards in this deck.
Unlock Deck
k this deck
49
Prior to running the simulation,using the Tornado Chart tool in Crystal Ball,for assumptions,creates two charts; a tornado chart and a ________.
A)scatter chart
B)pie chart
C)spider chart
D)column chart
A)scatter chart
B)pie chart
C)spider chart
D)column chart
Unlock Deck
Unlock for access to all 90 flashcards in this deck.
Unlock Deck
k this deck
50
Use the data set shown below to answer the following question(s). For this Newsvendor model,fit a distribution with Crystal Ball and use the Decision Table tool for analysis.Use 5,000 trials for the simulation.
For the above given data,the Decision Table tool will run a simulation for each of the ________ decision variable values defined.
A)20
B)12
C)11
D)10
For this Newsvendor model,fit a distribution with Crystal Ball and use the Decision Table tool for analysis.Use 5,000 trials for the simulation.For the above given data,the Decision Table tool will run a simulation for each of the ________ decision variable values defined.
A)20
B)12
C)11
D)10
Unlock Deck
Unlock for access to all 90 flashcards in this deck.
Unlock Deck
k this deck
51
With the inherent uncertainty in sales forecasts,________ is an appropriate tool to analyze cash budgets.
A)Crystal Ball
B)Latin Hypercube
C)PHStat
D)Monte Carlo simulation
A)Crystal Ball
B)Latin Hypercube
C)PHStat
D)Monte Carlo simulation
Unlock Deck
Unlock for access to all 90 flashcards in this deck.
Unlock Deck
k this deck
52
Use the data set shown below to answer the following question(s). The demand at the ticket booking center can be modeled by a Poisson distribution with a mean of 220.Assume that each reservation has a constant probability of p = 0.02 of being cancelled.Use Crystal Ball functions for the model.
For the data given above,which of the following Crystal Ball functions determines the customer demand?
A)CB.Binomial(220)
B)CB.Binomial(0.02,210)
C)CB.Poisson(220)
D)CB.Poisson(0.02,220)
The demand at the ticket booking center can be modeled by a Poisson distribution with a mean of 220.Assume that each reservation has a constant probability of p = 0.02 of being cancelled.Use Crystal Ball functions for the model.For the data given above,which of the following Crystal Ball functions determines the customer demand?
A)CB.Binomial(220)
B)CB.Binomial(0.02,210)
C)CB.Poisson(220)
D)CB.Poisson(0.02,220)
Unlock Deck
Unlock for access to all 90 flashcards in this deck.
Unlock Deck
k this deck
53
From the forecast charts for accepting 210 reservations,using the above data,there is about a(n)________ chance of overbooking at least one customer.
A)10%
B)52%
C)65%
D)84%
A)10%
B)52%
C)65%
D)84%
Unlock Deck
Unlock for access to all 90 flashcards in this deck.
Unlock Deck
k this deck
54
Use the data shown below to answer the following question(s).
Captain Jack Automobiles launched a new car and tabulated the below data for the new launch. The project manager identified the following distributions and parameters for these variables:
Market size: normal with a mean of 2,000,000 units and a standard deviation of 400,000 units
R&D costs: uniform between $639,000,000 and $781,000,000
Test Drives: lognormal with mean of $160,000,000 and standard deviation $16,000,000
Annual market growth factor: triangular with minimum = 2%,maximum = 6%,and most likely = 3%
Annual market share growth rate: triangular with minimum = 15%,maximum = 25%,and most likely = 20%
Use 5,000 trails to generate the simulation model for NPV using Crystal Ball.
Using the Tornado Chart tool,determine the assumption that has the greatest impact on the NPV.
A)Market size
B)R&D
C)Test Drives
D)Market growth factor
Captain Jack Automobiles launched a new car and tabulated the below data for the new launch.
The project manager identified the following distributions and parameters for these variables:Market size: normal with a mean of 2,000,000 units and a standard deviation of 400,000 units
R&D costs: uniform between $639,000,000 and $781,000,000
Test Drives: lognormal with mean of $160,000,000 and standard deviation $16,000,000
Annual market growth factor: triangular with minimum = 2%,maximum = 6%,and most likely = 3%
Annual market share growth rate: triangular with minimum = 15%,maximum = 25%,and most likely = 20%
Use 5,000 trails to generate the simulation model for NPV using Crystal Ball.
Using the Tornado Chart tool,determine the assumption that has the greatest impact on the NPV.
A)Market size
B)R&D
C)Test Drives
D)Market growth factor
Unlock Deck
Unlock for access to all 90 flashcards in this deck.
Unlock Deck
k this deck
55
Use the data set shown below to answer the following question(s). The demand at the ticket booking center can be modeled by a Poisson distribution with a mean of 220.Assume that each reservation has a constant probability of p = 0.02 of being cancelled.Use Crystal Ball functions for the model.
For the data given above,which of the following are defined as the forecast cells to run a simulation?
A)Customer demand and Reservation limit
B)Overbooked customers and Net revenue
C)Reservations made and Cancellations
D)Customer arrivals and Seats available
The demand at the ticket booking center can be modeled by a Poisson distribution with a mean of 220.Assume that each reservation has a constant probability of p = 0.02 of being cancelled.Use Crystal Ball functions for the model.For the data given above,which of the following are defined as the forecast cells to run a simulation?
A)Customer demand and Reservation limit
B)Overbooked customers and Net revenue
C)Reservations made and Cancellations
D)Customer arrivals and Seats available
Unlock Deck
Unlock for access to all 90 flashcards in this deck.
Unlock Deck
k this deck
56
Use the data set shown below to answer the following question(s). The demand at the ticket booking center can be modeled by a Poisson distribution with a mean of 220.Assume that each reservation has a constant probability of p = 0.02 of being cancelled.Use Crystal Ball functions for the model.
Using the above data,the number of overbooked customers is computed using ________.
A)MAX(Customer arrivals,Seats available)
B)MIN(0,Customer arrivals - Seats available)
C)MAX(0,Customer arrivals - Seats available)
D)MIN(Customer arrivals,Seats available)
The demand at the ticket booking center can be modeled by a Poisson distribution with a mean of 220.Assume that each reservation has a constant probability of p = 0.02 of being cancelled.Use Crystal Ball functions for the model.Using the above data,the number of overbooked customers is computed using ________.
A)MAX(Customer arrivals,Seats available)
B)MIN(0,Customer arrivals - Seats available)
C)MAX(0,Customer arrivals - Seats available)
D)MIN(Customer arrivals,Seats available)
Unlock Deck
Unlock for access to all 90 flashcards in this deck.
Unlock Deck
k this deck
57
Use the data set shown below to answer the following question(s). The demand at the ticket booking center can be modeled by a Poisson distribution with a mean of 220.Assume that each reservation has a constant probability of p = 0.02 of being cancelled.Use Crystal Ball functions for the model.
For the data given above,which of the following calculates the number of customer arrivals?
A)Reservation limit - Reservations made
B)Reservation limit - Cancellations
C)Cancellations + Reservations made
D)Reservations made - Cancellations
The demand at the ticket booking center can be modeled by a Poisson distribution with a mean of 220.Assume that each reservation has a constant probability of p = 0.02 of being cancelled.Use Crystal Ball functions for the model.For the data given above,which of the following calculates the number of customer arrivals?
A)Reservation limit - Reservations made
B)Reservation limit - Cancellations
C)Cancellations + Reservations made
D)Reservations made - Cancellations
Unlock Deck
Unlock for access to all 90 flashcards in this deck.
Unlock Deck
k this deck
58
The ________ in Crystal Ball is used to define an assumption based on the empirical distribution of the data.
A)Fit distribution
B)Custom distribution
C)Correlate button in the Define Assumption dialog
D)Bootstrap tool
A)Fit distribution
B)Custom distribution
C)Correlate button in the Define Assumption dialog
D)Bootstrap tool
Unlock Deck
Unlock for access to all 90 flashcards in this deck.
Unlock Deck
k this deck
59
Use the data set shown below to answer the following question(s). For this Newsvendor model,fit a distribution with Crystal Ball and use the Decision Table tool for analysis.Use 5,000 trials for the simulation.
Which of the following provides the lowest average profit?
A)Purchase quantity 57
B)Purchase quantity 58
C)Purchase quantity 59
D)Purchase quantity 60
For this Newsvendor model,fit a distribution with Crystal Ball and use the Decision Table tool for analysis.Use 5,000 trials for the simulation.Which of the following provides the lowest average profit?
A)Purchase quantity 57
B)Purchase quantity 58
C)Purchase quantity 59
D)Purchase quantity 60
Unlock Deck
Unlock for access to all 90 flashcards in this deck.
Unlock Deck
k this deck
60
Use the data shown below to answer the following question(s).
Captain Jack Automobiles launched a new car and tabulated the below data for the new launch. The project manager identified the following distributions and parameters for these variables:
Market size: normal with a mean of 2,000,000 units and a standard deviation of 400,000 units
R&D costs: uniform between $639,000,000 and $781,000,000
Test Drives: lognormal with mean of $160,000,000 and standard deviation $16,000,000
Annual market growth factor: triangular with minimum = 2%,maximum = 6%,and most likely = 3%
Annual market share growth rate: triangular with minimum = 15%,maximum = 25%,and most likely = 20%
Use 5,000 trails to generate the simulation model for NPV using Crystal Ball.
Using the Tornado Chart tool,determine the assumption that has the least impact on the NPV.
A)Market size
B)R&D
C)Test Drives
D)Time of cash flow
Captain Jack Automobiles launched a new car and tabulated the below data for the new launch.
The project manager identified the following distributions and parameters for these variables:Market size: normal with a mean of 2,000,000 units and a standard deviation of 400,000 units
R&D costs: uniform between $639,000,000 and $781,000,000
Test Drives: lognormal with mean of $160,000,000 and standard deviation $16,000,000
Annual market growth factor: triangular with minimum = 2%,maximum = 6%,and most likely = 3%
Annual market share growth rate: triangular with minimum = 15%,maximum = 25%,and most likely = 20%
Use 5,000 trails to generate the simulation model for NPV using Crystal Ball.
Using the Tornado Chart tool,determine the assumption that has the least impact on the NPV.
A)Market size
B)R&D
C)Test Drives
D)Time of cash flow
Unlock Deck
Unlock for access to all 90 flashcards in this deck.
Unlock Deck
k this deck
61
The Extract Data in the Analyze group of Crystal Ball,allows an individual to build customized reports for all or a subset of assumptions and output information.
Unlock Deck
Unlock for access to all 90 flashcards in this deck.
Unlock Deck
k this deck
62
In the analytical approach,if more than one critical path exists in a project management model,the path with the ________ is used.
A)largest expected activity time
B)smallest expected project completion time
C)smallest variance of activity time
D)largest variance of the distribution
A)largest expected activity time
B)smallest expected project completion time
C)smallest variance of activity time
D)largest variance of the distribution
Unlock Deck
Unlock for access to all 90 flashcards in this deck.
Unlock Deck
k this deck
63
In Crystal Ball,the Correlation Matrix tool allows an individual to define correlations between groups of assumptions in a model.
Unlock Deck
Unlock for access to all 90 flashcards in this deck.
Unlock Deck
k this deck
64
Explain in brief the functions of Crystal Ball.
Unlock Deck
Unlock for access to all 90 flashcards in this deck.
Unlock Deck
k this deck
65
Describe the procedure used to define assumptions in Crystal Ball.
Unlock Deck
Unlock for access to all 90 flashcards in this deck.
Unlock Deck
k this deck
66
________ is an analytical method that determines the probabilities of the project completion times in project management models by assuming that the expected activity times define the critical path and that the distribution of project completion time is normal using the central limit theorem.
A)Program Estimation and Research Technique
B)Project Evaluation and Revise Technique
C)Program Evaluation and Review Technique
D)Project Estimation and Risk Technique
A)Program Estimation and Research Technique
B)Project Evaluation and Revise Technique
C)Program Evaluation and Review Technique
D)Project Estimation and Risk Technique
Unlock Deck
Unlock for access to all 90 flashcards in this deck.
Unlock Deck
k this deck
67
Briefly describe the procedure to run a simulation.
Unlock Deck
Unlock for access to all 90 flashcards in this deck.
Unlock Deck
k this deck
68
Risk analysis seeks to examine the impacts of uncertainty in the estimates and their potential interaction with one another on the output variable of interest.
Unlock Deck
Unlock for access to all 90 flashcards in this deck.
Unlock Deck
k this deck
69
Optimum consulting is concerned about the maximum project time in one of their project management models.Using simulation,they found an estimate of the maximum project time to be about 364 days.To better understand the variability,Optimum consulting has used ________ that estimated the accuracy of the forecast statistics shown in the statistics view of the simulation results.
A)Scenario Analysis tool
B)Decision Table tool
C)2D Simulation tool
D)Bootstrap tool
A)Scenario Analysis tool
B)Decision Table tool
C)2D Simulation tool
D)Bootstrap tool
Unlock Deck
Unlock for access to all 90 flashcards in this deck.
Unlock Deck
k this deck
70
In Crystal Ball,the Forecast Charts show the sampled random variates superimposed over the theoretical distributions chosen as assumptions.
Unlock Deck
Unlock for access to all 90 flashcards in this deck.
Unlock Deck
k this deck
71
If several cells in the model have the same assumptions,you may use the Copy and Paste commands in the Define group within the Crystal Ball ribbon.
Unlock Deck
Unlock for access to all 90 flashcards in this deck.
Unlock Deck
k this deck
72
In Crystal Ball,uncertain inputs are called forecasts.
Unlock Deck
Unlock for access to all 90 flashcards in this deck.
Unlock Deck
k this deck
73
Define risk and risk analysis.
Unlock Deck
Unlock for access to all 90 flashcards in this deck.
Unlock Deck
k this deck
74
In Crystal Ball,the output variables in which we are interested are called assumptions.
Unlock Deck
Unlock for access to all 90 flashcards in this deck.
Unlock Deck
k this deck
75
Running the Tornado Charts tool before the Monte Carlo simulation helps in ________.
A)specifying correlation coefficients that define dependencies between assumptions
B)fitting continuous distributions from the empirical distribution of the data
C)screening out assumptions that would have little impact on the forecast
D)estimating the sampling distribution of any statistic,even an unconventional one such as the minimum or maximum endpoint of a forecast
Unlock Deck
Unlock for access to all 90 flashcards in this deck.
Unlock Deck
k this deck
76
In Crystal Ball,Latin Hypercube sampling results in a more even distribution of forecast values than Monte Carlo forecasting because it samples the entire range of the distribution in a more consistent manner.
Unlock Deck
Unlock for access to all 90 flashcards in this deck.
Unlock Deck
k this deck
77
List the steps used in Crystal Ball to run a Monte Carlo Simulation.
Unlock Deck
Unlock for access to all 90 flashcards in this deck.
Unlock Deck
k this deck
78
In the analytical approach,the probabilities of completing the project within a certain time are computed assuming that ________.
A)the expected project completion time is the product of the expected activity times along the critical path,which is found using the expected activity times
B)the variance of the distribution is the sum of the variances of those activities along the critical path,which is found using the expected activity times
C)the variance of the distribution is the sum of the variances of those activities along the critical path,which is found using the variances of activity times
D)the distribution of project completion times is not known
Unlock Deck
Unlock for access to all 90 flashcards in this deck.
Unlock Deck
k this deck
79
In Crystal Ball,Monte Carlo sampling divides each assumption's probability distribution into intervals of equal probability and generates an assumption value randomly within each interval.
Unlock Deck
Unlock for access to all 90 flashcards in this deck.
Unlock Deck
k this deck
80
Assumption cells in Crystal Ball can be defined for formula,nonnumeric,or blank cells.
Unlock Deck
Unlock for access to all 90 flashcards in this deck.
Unlock Deck
k this deck
Unlock Deck
Unlock for access to all 90 flashcards in this deck.


