Exam 10: Decision Models With Uncertainty and Risk
Exam 1: Data and Business Decisions93 Questions
Exam 2: Descriptive Statistics and Data Analysis99 Questions
Exam 3: Probability Concepts and Distributions111 Questions
Exam 4: Sampling and Estimation123 Questions
Exam 5: Hypothesis Testing and Statistical Inference99 Questions
Exam 6: Regression Analysis93 Questions
Exam 7: Forecasting100 Questions
Exam 8: Introduction to Statistical Quality Control101 Questions
Exam 9: Building and Using Decision Models74 Questions
Exam 10: Decision Models With Uncertainty and Risk90 Questions
Exam 11: Decisions, uncertainty, and Risk100 Questions
Exam 12: Queues and Process Simulation Modeling97 Questions
Exam 13: Linear Optimization98 Questions
Exam 14: Integer, nonlinear, and Advanced Optimization Methods100 Questions
Select questions type
________ is an analytical method that determines the probabilities of the project completion times in project management models by assuming that the expected activity times define the critical path and that the distribution of project completion time is normal using the central limit theorem.
Free
(Multiple Choice)
4.7/5  (26)
(26)
Correct Answer: Verified
C
In the third year,the company is likely to realize a cumulative net profit of $(407,199,952)with a probability of ________.
Free
(Multiple Choice)
4.9/5 (37)
Correct Answer:Verified
B
Use the data shown below to answer the following question(s).
Captain Jack Automobiles launched a new car and tabulated the below data for the new launch. 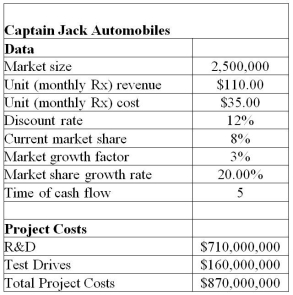 The project manager identified the following distributions and parameters for these variables:
Market size: normal with a mean of 2,000,000 units and a standard deviation of 400,000 units
R&D costs: uniform between $639,000,000 and $781,000,000
Test Drives: lognormal with mean of $160,000,000 and standard deviation $16,000,000
Annual market growth factor: triangular with minimum = 2%,maximum = 6%,and most likely = 3%
Annual market share growth rate: triangular with minimum = 15%,maximum = 25%,and most likely = 20%
Use 5,000 trails to generate the simulation model for NPV using Crystal Ball.
-Using the Tornado Chart tool,determine the assumption that has the least impact on the cumulative net profit for year 1.
The project manager identified the following distributions and parameters for these variables:
Market size: normal with a mean of 2,000,000 units and a standard deviation of 400,000 units
R&D costs: uniform between $639,000,000 and $781,000,000
Test Drives: lognormal with mean of $160,000,000 and standard deviation $16,000,000
Annual market growth factor: triangular with minimum = 2%,maximum = 6%,and most likely = 3%
Annual market share growth rate: triangular with minimum = 15%,maximum = 25%,and most likely = 20%
Use 5,000 trails to generate the simulation model for NPV using Crystal Ball.
-Using the Tornado Chart tool,determine the assumption that has the least impact on the cumulative net profit for year 1.
Free
(Multiple Choice)
4.8/5 (26)
Correct Answer:Verified
C
In Crystal Ball,Latin Hypercube sampling results in a more even distribution of forecast values than Monte Carlo forecasting because it samples the entire range of the distribution in a more consistent manner.
(True/False)
4.9/5 (30)
How does the Scenario Analysis tool in Crystal Ball help in simulation?
(Essay)
4.9/5 (28)
Use the data set shown below to answer the following question(s). 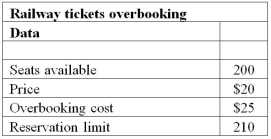 The demand at the ticket booking center can be modeled by a Poisson distribution with a mean of 220.Assume that each reservation has a constant probability of p = 0.02 of being cancelled.Use Crystal Ball functions for the model.
-For the data given above,the number of reservations made is obtained using the formula ________.
The demand at the ticket booking center can be modeled by a Poisson distribution with a mean of 220.Assume that each reservation has a constant probability of p = 0.02 of being cancelled.Use Crystal Ball functions for the model.
-For the data given above,the number of reservations made is obtained using the formula ________.
(Multiple Choice)
4.9/5 (35)
Use the data set shown below to answer the following question(s). The demand at the ticket booking center can be modeled by a Poisson distribution with a mean of 220.Assume that each reservation has a constant probability of p = 0.02 of being cancelled.Use Crystal Ball functions for the model.
-For the data given above,which of the following are defined as the forecast cells to run a simulation?
(Multiple Choice)
4.8/5 (33)
In the forecast chart for the cumulative net profit for year 2,you first anchor the right grabber at infinity,enter 70 in the Certainty box,and then hit the enter button.The above set of action determines the ________.
(Multiple Choice)
4.7/5 (36)
Latin Hypercube sampling differs from Monte Carlo Sampling in that Latin Hypercube sampling ________.
(Multiple Choice)
4.9/5 (31)
Why is sampling from empirical data not advisable to use when defining an assumption?
(Essay)
4.8/5 (40)
Use the data shown below to answer the following question(s).
Captain Jack Automobiles launched a new car and tabulated the below data for the new launch.  The project manager identified the following distributions and parameters for these variables:
Market size: normal with a mean of 2,000,000 units and a standard deviation of 400,000 units
R&D costs: uniform between $639,000,000 and $781,000,000
Test Drives: lognormal with mean of $160,000,000 and standard deviation $16,000,000
Annual market growth factor: triangular with minimum = 2%,maximum = 6%,and most likely = 3%
Annual market share growth rate: triangular with minimum = 15%,maximum = 25%,and most likely = 20%
Use 5,000 trials to generate the simulation model using Crystal Ball.
-The NPV to be generated from the data given above is called a(n)________.
The project manager identified the following distributions and parameters for these variables:
Market size: normal with a mean of 2,000,000 units and a standard deviation of 400,000 units
R&D costs: uniform between $639,000,000 and $781,000,000
Test Drives: lognormal with mean of $160,000,000 and standard deviation $16,000,000
Annual market growth factor: triangular with minimum = 2%,maximum = 6%,and most likely = 3%
Annual market share growth rate: triangular with minimum = 15%,maximum = 25%,and most likely = 20%
Use 5,000 trials to generate the simulation model using Crystal Ball.
-The NPV to be generated from the data given above is called a(n)________.
(Multiple Choice)
4.9/5 (39)
Running the Tornado Charts tool before the Monte Carlo simulation helps in ________.
(Multiple Choice)
4.8/5 (29)
Use the data shown below to answer the following question(s).
Captain Jack Automobiles launched a new car and tabulated the below data for the new launch. The project manager identified the following distributions and parameters for these variables:
Market size: normal with a mean of 2,000,000 units and a standard deviation of 400,000 units
R&D costs: uniform between $639,000,000 and $781,000,000
Test Drives: lognormal with mean of $160,000,000 and standard deviation $16,000,000
Annual market growth factor: triangular with minimum = 2%,maximum = 6%,and most likely = 3%
Annual market share growth rate: triangular with minimum = 15%,maximum = 25%,and most likely = 20%
Use 5,000 trials to generate the simulation model using Crystal Ball.
-In the NPV forecast chart generated after running the simulation,you enter the number 0 in the left range box of the forecast chart and press the enter key.What exactly is the result of the above action?
(Multiple Choice)
4.8/5 (38)
Risk analysis seeks to examine the impacts of uncertainty in the estimates and their potential interaction with one another on the output variable of interest.
(True/False)
4.8/5 (30)
Optimum consulting is concerned about the maximum project time in one of their project management models.Using simulation,they found an estimate of the maximum project time to be about 364 days.To better understand the variability,Optimum consulting has used ________ that estimated the accuracy of the forecast statistics shown in the statistics view of the simulation results.
(Multiple Choice)
4.8/5 (34)
Use the data shown below to answer the following question(s).
Captain Jack Automobiles launched a new car and tabulated the below data for the new launch. The project manager identified the following distributions and parameters for these variables:
Market size: normal with a mean of 2,000,000 units and a standard deviation of 400,000 units
R&D costs: uniform between $639,000,000 and $781,000,000
Test Drives: lognormal with mean of $160,000,000 and standard deviation $16,000,000
Annual market growth factor: triangular with minimum = 2%,maximum = 6%,and most likely = 3%
Annual market share growth rate: triangular with minimum = 15%,maximum = 25%,and most likely = 20%
Use 5,000 trails to generate the simulation model for NPV using Crystal Ball.
-Using the Tornado Chart tool,determine the assumption that has the greatest impact on the NPV.
(Multiple Choice)
4.9/5 (29)
Filters
- Essay(0)
- Multiple Choice(0)
- Short Answer(0)
- True False(0)
- Matching(0)