Deck 19: Economic Inequality
Full screen (f)
Question
Question
Question
Question
Question
Question
Question
Question
Question
Question
Question
Question
Question
Question
Use the figure below to answer the following questions.
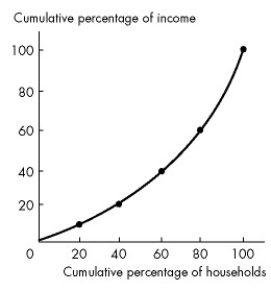 Figure 19.1.1
Refer to Figure 19.11.The richest 20 percent of households receive what share of total income?
A)10 percent
B)30 percent
C)40 percent
D)60 percent
E)100 percent
Figure 19.1.1Refer to Figure 19.11.The richest 20 percent of households receive what share of total income?
A)10 percent
B)30 percent
C)40 percent
D)60 percent
E)100 percent
Question
Use the figure below to answer the following questions.
Figure 19.1.1
Refer to Figure 19.11.The middle 20 percent of households receive what share of total income?
A)20 percent
B)25 percent
C)35 percent
D)15 percent
E)60 percent
Figure 19.1.1Refer to Figure 19.11.The middle 20 percent of households receive what share of total income?
A)20 percent
B)25 percent
C)35 percent
D)15 percent
E)60 percent
Question
Use the figure below to answer the following questions.
Figure 19.1.1
Refer to Figure 19.11.The poorest 20 percent of households receive what share of total income?
A)40 percent
B)60 percent
C)20 percent
D)5 percent
E)10 percent
Figure 19.1.1Refer to Figure 19.11.The poorest 20 percent of households receive what share of total income?
A)40 percent
B)60 percent
C)20 percent
D)5 percent
E)10 percent
Question
Question
Question
Question
Question
Question
Question
Question
Use the figure below to answer the following questions.
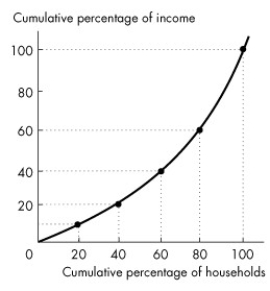 Figure 19.1.3
In Figure 19.1.3,the poorest 20 percent of all families receive what share of income?
A)10 percent
B)20 percent
C)30 percent
D)40 percent
E)none of the above
Figure 19.1.3In Figure 19.1.3,the poorest 20 percent of all families receive what share of income?
A)10 percent
B)20 percent
C)30 percent
D)40 percent
E)none of the above
Question
Question
Question
Question
Use the figure below to answer the following questions.
Figure 19.1.3
The curve in Figure 19.1.3 is the
A)line of fairness.
B)line of equality.
C)learning curve.
D)wage differential curve.
E)Lorenz curve.
Figure 19.1.3The curve in Figure 19.1.3 is the
A)line of fairness.
B)line of equality.
C)learning curve.
D)wage differential curve.
E)Lorenz curve.
Question
Use the figure below to answer the following questions.
Figure 19.1.3
In Figure 19.1.3,the second poorest 20 percent of all families receive what share of income?
A)10 percent
B)20 percent
C)30 percent
D)40 percent
E)none of the above
Figure 19.1.3In Figure 19.1.3,the second poorest 20 percent of all families receive what share of income?
A)10 percent
B)20 percent
C)30 percent
D)40 percent
E)none of the above
Question
Use the figure below to answer the following questions.
Figure 19.1.3
In Figure 19.1.3,the richest 20 percent of all families receive what share of all income?
A)10 percent
B)20 percent
C)30 percent
D)40 percent
E)none of the above
Figure 19.1.3In Figure 19.1.3,the richest 20 percent of all families receive what share of all income?
A)10 percent
B)20 percent
C)30 percent
D)40 percent
E)none of the above
Question
Use the figure below to answer the following questions.
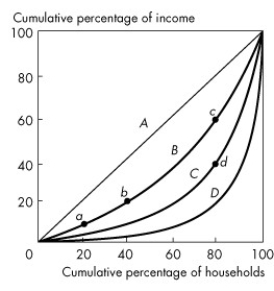 Figure 19.1.2
Consider the Lorenz curves in Figure 19.1.2.Which Lorenz curve corresponds to the greatest income inequality?
A)A
B)B
C)C
D)D
E)impossible to tell without additional information
Figure 19.1.2Consider the Lorenz curves in Figure 19.1.2.Which Lorenz curve corresponds to the greatest income inequality?
A)A
B)B
C)C
D)D
E)impossible to tell without additional information
Question
Question
Question
Question
Use the figure below to answer the following questions.
Figure 19.1.3
In Figure 19.1.3,the second richest 20 percent of all families receive what share of income?
A)10 percent
B)20 percent
C)30 percent
D)40 percent
E)none of the above
Figure 19.1.3In Figure 19.1.3,the second richest 20 percent of all families receive what share of income?
A)10 percent
B)20 percent
C)30 percent
D)40 percent
E)none of the above
Question
Question
Question
Use the figure below to answer the following questions.
Figure 19.1.3
In Figure 19.1.3,the middle 20 percent of all families receive what share of income?
A)10 percent
B)20 percent
C)30 percent
D)40 percent
E)none of the above
Figure 19.1.3In Figure 19.1.3,the middle 20 percent of all families receive what share of income?
A)10 percent
B)20 percent
C)30 percent
D)40 percent
E)none of the above
Question
Question
Question
Question
Question
Question
Question
Question
Question
Use the figure below to answer the following questions.
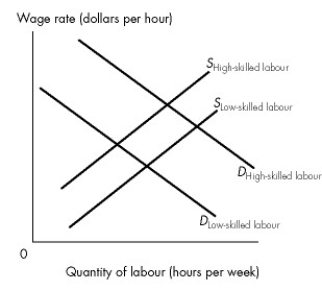 Figure 19.3.1
Refer to Figure 19.2.1.For any given quantity of labour employed,
A)the elasticity of demand for high-skilled labourers is less than the elasticity of demand for low-skilled labourers.
B)high-skilled labourers will receive a lower wage than low-skilled labourers.
C)high-skilled labourers will receive a greater wage than low-skilled labourers.
D)the vertical distance between the two demand curves is the compensation for the cost of acquiring the skill.
E)the vertical distance between the two curves is the present value of human capital.
Figure 19.3.1Refer to Figure 19.2.1.For any given quantity of labour employed,
A)the elasticity of demand for high-skilled labourers is less than the elasticity of demand for low-skilled labourers.
B)high-skilled labourers will receive a lower wage than low-skilled labourers.
C)high-skilled labourers will receive a greater wage than low-skilled labourers.
D)the vertical distance between the two demand curves is the compensation for the cost of acquiring the skill.
E)the vertical distance between the two curves is the present value of human capital.
Question
Use the figure below to answer the following questions.
Figure 19.3.1
Refer to Figure 19.3.1.At any given employment level,the vertical distance between the demand curves of the high-skilled and low-skilled workers
A)is equal to the difference in the value of marginal product of the workers.
B)is equal to the difference in the work ethic of the workers.
C)is caused by discrimination against minorities.
D)is caused by discrimination against women.
E)equals the cost of acquiring the skills.
Figure 19.3.1Refer to Figure 19.3.1.At any given employment level,the vertical distance between the demand curves of the high-skilled and low-skilled workers
A)is equal to the difference in the value of marginal product of the workers.
B)is equal to the difference in the work ethic of the workers.
C)is caused by discrimination against minorities.
D)is caused by discrimination against women.
E)equals the cost of acquiring the skills.
Question
Question
Question
Question
Question
Use the figure below to answer the following questions.
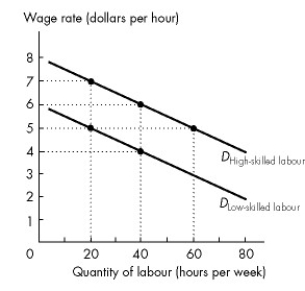 Figure 19.3.2
Refer to Figure 19.3.2.At an employment level of 40 hours per week,the difference in the value of marginal product of high-skilled workers and low-skilled workers is
A)$0.
B)$2 an hour.
C)$6 an hour.
D)$4 an hour.
E)$3 an hour.
Figure 19.3.2Refer to Figure 19.3.2.At an employment level of 40 hours per week,the difference in the value of marginal product of high-skilled workers and low-skilled workers is
A)$0.
B)$2 an hour.
C)$6 an hour.
D)$4 an hour.
E)$3 an hour.
Question
Question
Question
Question
Question
Question
Use the figure below to answer the following questions.
Figure 19.3.2
Refer to Figure 19.3.2.At an employment level of 20 hours per week,firms are willing to pay
A)a wage rate of $7 an hour to low-skilled workers.
B)a maximum of $5 an hour to high-skilled workers.
C)up to $7 an hour for high-skilled workers.
D)the same for high-skilled workers as for low-skilled workers.
E)$3 an hour more for high-skilled workers.
Figure 19.3.2Refer to Figure 19.3.2.At an employment level of 20 hours per week,firms are willing to pay
A)a wage rate of $7 an hour to low-skilled workers.
B)a maximum of $5 an hour to high-skilled workers.
C)up to $7 an hour for high-skilled workers.
D)the same for high-skilled workers as for low-skilled workers.
E)$3 an hour more for high-skilled workers.
Question
Question
Use the figure below to answer the following question.
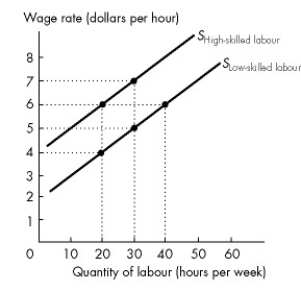 Figure 19.3.4
Refer to Figure 19.3.4.At an employment level of 30 hours per week,the compensation required for the cost of acquiring human capital is
A)$0.
B)$2 an hour.
C)$4 an hour.
D)$6 an hour.
E)cannot be determined without knowing the demand for labour.
Figure 19.3.4Refer to Figure 19.3.4.At an employment level of 30 hours per week,the compensation required for the cost of acquiring human capital is
A)$0.
B)$2 an hour.
C)$4 an hour.
D)$6 an hour.
E)cannot be determined without knowing the demand for labour.
Question
Question
Question
Question
Question
Question
Use the figure below to answer the following questions.
Figure 19.3.2
Refer to Figure 19.3.2.At a wage rate of $5,an employer would hire
A)the same amount of high-skilled workers and low-skilled workers.
B)20 hours of low-skilled labour and 40 hours of high-skilled labour.
C)60 hours of low-skilled labour and 20 hours of high-skilled labour.
D)20 hours of low-skilled labour and 60 hours of high-skilled labour.
E)40 hours of low-skilled labour and 60 hours of high-skilled labour.
Figure 19.3.2Refer to Figure 19.3.2.At a wage rate of $5,an employer would hire
A)the same amount of high-skilled workers and low-skilled workers.
B)20 hours of low-skilled labour and 40 hours of high-skilled labour.
C)60 hours of low-skilled labour and 20 hours of high-skilled labour.
D)20 hours of low-skilled labour and 60 hours of high-skilled labour.
E)40 hours of low-skilled labour and 60 hours of high-skilled labour.
Question
Question
Use the figure below to answer the following questions.
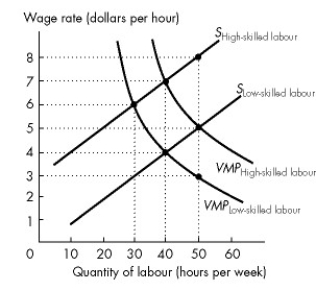 Figure 19.3.5
Refer to Figure 19.3.5.This figure shows the labour supply curves and the value of marginal product curves for high-skilled and low-skilled workers.The equilibrium wage rate for high-skilled workers is
A)$5 an hour.
B)$4 an hour.
C)$6 an hour.
D)$8 an hour.
E)$7 an hour.
Figure 19.3.5Refer to Figure 19.3.5.This figure shows the labour supply curves and the value of marginal product curves for high-skilled and low-skilled workers.The equilibrium wage rate for high-skilled workers is
A)$5 an hour.
B)$4 an hour.
C)$6 an hour.
D)$8 an hour.
E)$7 an hour.
Question
Use the figure below to answer the following questions.
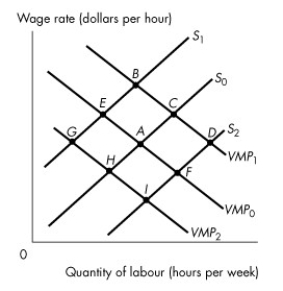 Figure 19.3.6
Refer to Figure 19.3.6.If this is the market for a group of workers who are discriminated against by customers and point A represents the equilibrium without discrimination,which point represents the equilibrium for the workers who are discriminated against?
A)D
B)B
C)I
D)C
E)H
Figure 19.3.6Refer to Figure 19.3.6.If this is the market for a group of workers who are discriminated against by customers and point A represents the equilibrium without discrimination,which point represents the equilibrium for the workers who are discriminated against?
A)D
B)B
C)I
D)C
E)H
Question
Use the figure below to answer the following questions.
Figure 19.3.5
Refer to Figure 19.3.5.This figure shows the labour supply curves and the value of marginal product curves for high-skilled and low-skilled workers.The equilibrium wage rate for low-skilled workers is
A)$3 an hour.
B)$7 an hour.
C)$6 an hour.
D)$5 an hour.
E)$4 an hour.
Figure 19.3.5Refer to Figure 19.3.5.This figure shows the labour supply curves and the value of marginal product curves for high-skilled and low-skilled workers.The equilibrium wage rate for low-skilled workers is
A)$3 an hour.
B)$7 an hour.
C)$6 an hour.
D)$5 an hour.
E)$4 an hour.
Question
Use the figure below to answer the following question.
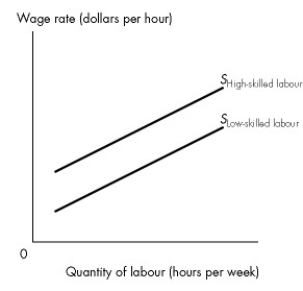 Figure 19.3.3
Refer to Figure 19.3.3.At any given level of employment for high-skilled and low-skilled workers,the vertical distance between the two supply curves
A)disappears if there is free entry into the skill market.
B)disappears if there is equal pay for work of equal value.
C)is created by discrimination against low-skilled workers.
D)is the compensation required for the cost of acquiring human capital.
E)equals the value of marginal product of skill.
Figure 19.3.3Refer to Figure 19.3.3.At any given level of employment for high-skilled and low-skilled workers,the vertical distance between the two supply curves
A)disappears if there is free entry into the skill market.
B)disappears if there is equal pay for work of equal value.
C)is created by discrimination against low-skilled workers.
D)is the compensation required for the cost of acquiring human capital.
E)equals the value of marginal product of skill.
Question
Question
Question
Question
Use the figure below to answer the following questions.
Figure 19.3.5
Refer to Figure 19.3.5.This figure shows the labour supply curves and the value of marginal product curves for high-skilled and low-skilled workers.If there is an increase in the supply of high-skilled workers and the supply of high-skilled workers is now equal to the supply of low-skilled workers,then
A)wages paid to high-skilled workers would fall to $4 an hour.
B)wages paid to high-skilled workers would fall to $5 an hour.
C)wages paid to high-skilled workers would fall to $6 an hour.
D)there would be no change in the wages of high-skilled workers,because high-skilled workers always earn more than low-skilled workers.
E)there would be no change in the wages of high-skilled workers,because their value of marginal product is unchanged.
Figure 19.3.5Refer to Figure 19.3.5.This figure shows the labour supply curves and the value of marginal product curves for high-skilled and low-skilled workers.If there is an increase in the supply of high-skilled workers and the supply of high-skilled workers is now equal to the supply of low-skilled workers,then
A)wages paid to high-skilled workers would fall to $4 an hour.
B)wages paid to high-skilled workers would fall to $5 an hour.
C)wages paid to high-skilled workers would fall to $6 an hour.
D)there would be no change in the wages of high-skilled workers,because high-skilled workers always earn more than low-skilled workers.
E)there would be no change in the wages of high-skilled workers,because their value of marginal product is unchanged.
Question
Use the figure below to answer the following questions.
Figure 19.3.5
Refer to Figure 19.3.5.This figure shows the labour supply curves and the value of marginal product curves for high-skilled and low-skilled workers.If the labour markets are competitive,then for a 40-hour work week,high-skilled workers must be paid
A)an extra $3 to compensate for the cost of acquiring their human capital and for their increased productivity.
B)an extra $20 to compensate for the cost of acquiring their human capital and for their increased productivity.
C)an extra $120 to compensate for the cost of acquiring their human capital and for their increased productivity.
D)an extra $300 to compensate for the cost of acquiring their human capital and for their enhanced productivity.
E)an extra $180 to compensate for the cost of acquiring their human capital and for their increased productivity.
Figure 19.3.5Refer to Figure 19.3.5.This figure shows the labour supply curves and the value of marginal product curves for high-skilled and low-skilled workers.If the labour markets are competitive,then for a 40-hour work week,high-skilled workers must be paid
A)an extra $3 to compensate for the cost of acquiring their human capital and for their increased productivity.
B)an extra $20 to compensate for the cost of acquiring their human capital and for their increased productivity.
C)an extra $120 to compensate for the cost of acquiring their human capital and for their increased productivity.
D)an extra $300 to compensate for the cost of acquiring their human capital and for their enhanced productivity.
E)an extra $180 to compensate for the cost of acquiring their human capital and for their increased productivity.
Question
Question
Question
Use the figure below to answer the following questions.
Figure 19.3.2
Refer to Figure 19.3.2.For the employer to hire 40 hours per week of both high-skilled and low-skilled labour,
A)high-skilled workers would have to earn a wage rate that is twice that of the low-skilled workers.
B)high-skilled workers would have to earn a wage rate that is less than that of the low-skilled workers.
C)high-skilled workers would have to earn a wage that is $2 more than the wage paid to low-skilled workers.
D)low-skilled workers would have to earn a wage that is $2 more than the wage paid to high-skilled workers.
E)high-skilled workers need to earn a wage that is between zero and $2 more than low-skilled workers.
Figure 19.3.2Refer to Figure 19.3.2.For the employer to hire 40 hours per week of both high-skilled and low-skilled labour,
A)high-skilled workers would have to earn a wage rate that is twice that of the low-skilled workers.
B)high-skilled workers would have to earn a wage rate that is less than that of the low-skilled workers.
C)high-skilled workers would have to earn a wage that is $2 more than the wage paid to low-skilled workers.
D)low-skilled workers would have to earn a wage that is $2 more than the wage paid to high-skilled workers.
E)high-skilled workers need to earn a wage that is between zero and $2 more than low-skilled workers.

Unlock Deck
Sign up to unlock the cards in this deck!
Unlock Deck
Unlock Deck
1/117
Play
Full screen (f)
Deck 19: Economic Inequality
1
Total income equals
A)market income minus payments to firms by governments.
B)market income plus cash payments to households by governments.
C)the wages,interest,rent,and profit earned in factor markets before paying income taxes.
D)the wages,interest,rent,and profit earned in factor markets after paying income taxes.
E)market income minus cash payments to households by governments.
B
2
In 2009,the median household income in Canada was
A)$5,000.
B)$25,000.
C)$48,300.
D)$59,700.
E)$65,000.
A)$5,000.
B)$25,000.
C)$48,300.
D)$59,700.
E)$65,000.
C
3
In 2009,the middle 20 percent of households received what percentage of total Canadian after-tax income?
A)10.6 percent
B)16.3 percent
C)25 percent
D)43 percent
E)52 percent
A)10.6 percent
B)16.3 percent
C)25 percent
D)43 percent
E)52 percent
B
4
In 2009,the poorest 20 percent of households received what percentage of the nation's after-tax income?
A)10.6 percent
B)4.9 percent
C)24.0 percent
D)16.3 percent
E)17.4 percent
A)10.6 percent
B)4.9 percent
C)24.0 percent
D)16.3 percent
E)17.4 percent
Unlock Deck
Unlock for access to all 117 flashcards in this deck.
Unlock Deck
k this deck
5
In 2009,the mean household income in Canada was
A)$59,700.
B)$39,700.
C)$25,000.
D)$48,300.
E)$65,000.
A)$59,700.
B)$39,700.
C)$25,000.
D)$48,300.
E)$65,000.
Unlock Deck
Unlock for access to all 117 flashcards in this deck.
Unlock Deck
k this deck
6
An income Lorenz curve
A)graphs the cumulative percentage of income against the cumulative percentage of households.
B)measures the income among households ranked from the poorest to the richest.
C)measures the income among households ranked from the richest to the poorest.
D)measures the factor prices earned by the rich compared with the poor.
E)is a downward-sloping curve.
Unlock Deck
Unlock for access to all 117 flashcards in this deck.
Unlock Deck
k this deck
7
Market income equals
A)the wages,interest,rent,and profit earned in factor markets after paying income taxes.
B)the wages,interest,and profit earned in factor markets before paying income taxes.
C)the wages,interest,and rent earned in factor markets before paying income taxes.
D)the wages,interest,rent,and profit earned in factor markets before paying income taxes.
E)the wages,rent,and profit earned in factor markets before paying income taxes.
Unlock Deck
Unlock for access to all 117 flashcards in this deck.
Unlock Deck
k this deck
8
In 2009,what percentage of households received the mode income in Canada?
A)5 percent
B)10 percent
C)7 percent
D)17.4 percent
E)20 percent
A)5 percent
B)10 percent
C)7 percent
D)17.4 percent
E)20 percent
Unlock Deck
Unlock for access to all 117 flashcards in this deck.
Unlock Deck
k this deck
9
Household characteristics that stand out when determining the incidence of poverty include all of the following except
A)household type.
B)education.
C)age of householder.
D)ethnic background.
E)number of children.
A)household type.
B)education.
C)age of householder.
D)ethnic background.
E)number of children.
Unlock Deck
Unlock for access to all 117 flashcards in this deck.
Unlock Deck
k this deck
10
Which of the following does Statistics Canada use to provide measures of economic inequality?
A)market income only
B)market income and after-tax income only
C)after-tax income only
D)total market and after-tax income only
E)market income,total income,and after-tax income
A)market income only
B)market income and after-tax income only
C)after-tax income only
D)total market and after-tax income only
E)market income,total income,and after-tax income
Unlock Deck
Unlock for access to all 117 flashcards in this deck.
Unlock Deck
k this deck
11
The closer the Lorenz curve is to the line of equality,
A)the more equal is the distribution.
B)the less equal is the distribution.
C)the more unfair is the income distribution.
D)the richer are the highest 5 percent of households.
E)the poorer are the highest 5 percent of households.
A)the more equal is the distribution.
B)the less equal is the distribution.
C)the more unfair is the income distribution.
D)the richer are the highest 5 percent of households.
E)the poorer are the highest 5 percent of households.
Unlock Deck
Unlock for access to all 117 flashcards in this deck.
Unlock Deck
k this deck
12
In 2009,the 20 percent of households with the highest incomes received what percentage of the total after-tax income?
A)14 percent
B)2 percent
C)71 percent
D)44.2 percent
E)55.8 percent
A)14 percent
B)2 percent
C)71 percent
D)44.2 percent
E)55.8 percent
Unlock Deck
Unlock for access to all 117 flashcards in this deck.
Unlock Deck
k this deck
13
If each household made the same amount of income,then the Lorenz curve would be
A)not defined,because it measures income inequality not income equality.
B)the line of poverty.
C)the line of equality.
D)a right angle.
E)horizontal.
A)not defined,because it measures income inequality not income equality.
B)the line of poverty.
C)the line of equality.
D)a right angle.
E)horizontal.
Unlock Deck
Unlock for access to all 117 flashcards in this deck.
Unlock Deck
k this deck
14
Use the figure below to answer the following questions.
Figure 19.1.1
Refer to Figure 19.11.The richest 20 percent of households receive what share of total income?
A)10 percent
B)30 percent
C)40 percent
D)60 percent
E)100 percent
Figure 19.1.1Refer to Figure 19.11.The richest 20 percent of households receive what share of total income?
A)10 percent
B)30 percent
C)40 percent
D)60 percent
E)100 percent
Unlock Deck
Unlock for access to all 117 flashcards in this deck.
Unlock Deck
k this deck
15
Use the figure below to answer the following questions.
Figure 19.1.1
Refer to Figure 19.11.The middle 20 percent of households receive what share of total income?
A)20 percent
B)25 percent
C)35 percent
D)15 percent
E)60 percent
Figure 19.1.1Refer to Figure 19.11.The middle 20 percent of households receive what share of total income?
A)20 percent
B)25 percent
C)35 percent
D)15 percent
E)60 percent
Unlock Deck
Unlock for access to all 117 flashcards in this deck.
Unlock Deck
k this deck
16
Use the figure below to answer the following questions.
Figure 19.1.1
Refer to Figure 19.11.The poorest 20 percent of households receive what share of total income?
A)40 percent
B)60 percent
C)20 percent
D)5 percent
E)10 percent
Figure 19.1.1Refer to Figure 19.11.The poorest 20 percent of households receive what share of total income?
A)40 percent
B)60 percent
C)20 percent
D)5 percent
E)10 percent
Unlock Deck
Unlock for access to all 117 flashcards in this deck.
Unlock Deck
k this deck
17
The larger the gap between the Lorenz curve and the line of equality,
A)the greater is the equality in the income distribution.
B)the less is the inequality in the income distribution.
C)the poorer are the top 50 percent of households.
D)the richer are the lowest 50 percent of households.
E)the greater is the inequality in the income distribution.
A)the greater is the equality in the income distribution.
B)the less is the inequality in the income distribution.
C)the poorer are the top 50 percent of households.
D)the richer are the lowest 50 percent of households.
E)the greater is the inequality in the income distribution.
Unlock Deck
Unlock for access to all 117 flashcards in this deck.
Unlock Deck
k this deck
18
In 2009,the mode income received by 7.0 percent of households in Canada was between
A)$18,500 and $21,999.
B)$15,000 and $19,999.
C)$30,000 and $34,999.
D)$16,000 and $22,500.
E)$18,000 and $24,999.
A)$18,500 and $21,999.
B)$15,000 and $19,999.
C)$30,000 and $34,999.
D)$16,000 and $22,500.
E)$18,000 and $24,999.
Unlock Deck
Unlock for access to all 117 flashcards in this deck.
Unlock Deck
k this deck
19
A Lorenz curve illustrates the distribution of income by graphing the
A)cumulative percentage of income received and the cumulative percentage of households.
B)chance of a family earning a specific income.
C)wealth earned by a cumulative percentage of households.
D)cumulative frequency of specific incomes.
E)percentage change in income for a percentage change in population.
Unlock Deck
Unlock for access to all 117 flashcards in this deck.
Unlock Deck
k this deck
20
After-tax income equals
A)total income minus tax payments by households to governments.
B)total income minus tax payments by households to firms.
C)total income plus tax payments by households to governments.
D)market income plus cash payments to households by governments.
E)market income minus tax payments by households to governments.
Unlock Deck
Unlock for access to all 117 flashcards in this deck.
Unlock Deck
k this deck
21
The low-income cutoff level is
A)a level of housing and food provided by the government.
B)a fixed real income used to determine whether or not a household may qualify for welfare.
C)the income level below which a family normally spends 73.6 percent or more of its income on food,shelter,and clothing.
D)the income level below which a family normally spends 63.6 percent or more of its income on food,shelter,and clothing.
E)a level of income below which starvation occurs.
Unlock Deck
Unlock for access to all 117 flashcards in this deck.
Unlock Deck
k this deck
22
Which point in Figure 19.1.2 indicates that the richest 20 percent of families earn 40 percent of the income?
A)a
B)b
C)c
D)d
E)none of the above
A)a
B)b
C)c
D)d
E)none of the above
Unlock Deck
Unlock for access to all 117 flashcards in this deck.
Unlock Deck
k this deck
23
Poverty is
A)an income below the national average income level.
B)an income below the national median income level.
C)a state in which a family's income is too low to be able to buy the quantities of food,shelter,and clothing that are deemed necessary.
D)the income earned by the poorest 20 percent of households.
E)a state in which a family spends more than 50 percent of its income on food,shelter,and clothing.
Unlock Deck
Unlock for access to all 117 flashcards in this deck.
Unlock Deck
k this deck
24
Use the figure below to answer the following questions.
Figure 19.1.3
In Figure 19.1.3,the poorest 20 percent of all families receive what share of income?
A)10 percent
B)20 percent
C)30 percent
D)40 percent
E)none of the above
Figure 19.1.3In Figure 19.1.3,the poorest 20 percent of all families receive what share of income?
A)10 percent
B)20 percent
C)30 percent
D)40 percent
E)none of the above
Unlock Deck
Unlock for access to all 117 flashcards in this deck.
Unlock Deck
k this deck
25
The wealthiest 10 percent of Canadian families own approximately
A)10 percent of the wealth.
B)17 percent of the wealth.
C)56 percent of the wealth.
D)67 percent of the wealth.
E)80 percent of the wealth.
A)10 percent of the wealth.
B)17 percent of the wealth.
C)56 percent of the wealth.
D)67 percent of the wealth.
E)80 percent of the wealth.
Unlock Deck
Unlock for access to all 117 flashcards in this deck.
Unlock Deck
k this deck
26
Consider the Lorenz curves in Figure 19.1.2.Which point indicates that the richest 20 percent of families earn 80 percent of the income?
A)a
B)b
C)c
D)d
E)none of the above
A)a
B)b
C)c
D)d
E)none of the above
Unlock Deck
Unlock for access to all 117 flashcards in this deck.
Unlock Deck
k this deck
27
From an examination of data on income and wealth,it can be concluded that
A)wealth distribution is more equal than income distribution.
B)income distribution is more equal than wealth distribution.
C)wealth distribution is equal to income distribution.
D)income and wealth are the same.
E)income and wealth are unrelated.
A)wealth distribution is more equal than income distribution.
B)income distribution is more equal than wealth distribution.
C)wealth distribution is equal to income distribution.
D)income and wealth are the same.
E)income and wealth are unrelated.
Unlock Deck
Unlock for access to all 117 flashcards in this deck.
Unlock Deck
k this deck
28
Use the figure below to answer the following questions.
Figure 19.1.3
The curve in Figure 19.1.3 is the
A)line of fairness.
B)line of equality.
C)learning curve.
D)wage differential curve.
E)Lorenz curve.
Figure 19.1.3The curve in Figure 19.1.3 is the
A)line of fairness.
B)line of equality.
C)learning curve.
D)wage differential curve.
E)Lorenz curve.
Unlock Deck
Unlock for access to all 117 flashcards in this deck.
Unlock Deck
k this deck
29
Use the figure below to answer the following questions.
Figure 19.1.3
In Figure 19.1.3,the second poorest 20 percent of all families receive what share of income?
A)10 percent
B)20 percent
C)30 percent
D)40 percent
E)none of the above
Figure 19.1.3In Figure 19.1.3,the second poorest 20 percent of all families receive what share of income?
A)10 percent
B)20 percent
C)30 percent
D)40 percent
E)none of the above
Unlock Deck
Unlock for access to all 117 flashcards in this deck.
Unlock Deck
k this deck
30
Use the figure below to answer the following questions.
Figure 19.1.3
In Figure 19.1.3,the richest 20 percent of all families receive what share of all income?
A)10 percent
B)20 percent
C)30 percent
D)40 percent
E)none of the above
Figure 19.1.3In Figure 19.1.3,the richest 20 percent of all families receive what share of all income?
A)10 percent
B)20 percent
C)30 percent
D)40 percent
E)none of the above
Unlock Deck
Unlock for access to all 117 flashcards in this deck.
Unlock Deck
k this deck
31
Use the figure below to answer the following questions.
Figure 19.1.2
Consider the Lorenz curves in Figure 19.1.2.Which Lorenz curve corresponds to the greatest income inequality?
A)A
B)B
C)C
D)D
E)impossible to tell without additional information
Figure 19.1.2Consider the Lorenz curves in Figure 19.1.2.Which Lorenz curve corresponds to the greatest income inequality?
A)A
B)B
C)C
D)D
E)impossible to tell without additional information
Unlock Deck
Unlock for access to all 117 flashcards in this deck.
Unlock Deck
k this deck
32
In Canada,the low-income cut-off level for a family is when ________ or more of income is spent on food,shelter,and clothing.
A)33.6 percent
B)43.6 percent
C)53.6 percent
D)63.6 percent
E)73.6 percent
A)33.6 percent
B)43.6 percent
C)53.6 percent
D)63.6 percent
E)73.6 percent
Unlock Deck
Unlock for access to all 117 flashcards in this deck.
Unlock Deck
k this deck
33
Which diagram is used by economists to illustrate the distribution of income or wealth?
A)Lorenz curve
B)normal bell-shaped distribution
C)wage differential curve
D)low-income cut-off curve
E)marginal revenue product diagram
A)Lorenz curve
B)normal bell-shaped distribution
C)wage differential curve
D)low-income cut-off curve
E)marginal revenue product diagram
Unlock Deck
Unlock for access to all 117 flashcards in this deck.
Unlock Deck
k this deck
34
The inequality in the distribution of wealth is
A)less than the inequality in the distribution of income.
B)decreased by the existence of assortative mating.
C)a better measure of the inequality in the distribution of economic resources than is the inequality in the distribution of income.
D)shown by a Lorenz curve that is farther away from the line of equality than the Lorenz curve for income.
E)all of the above.
Unlock Deck
Unlock for access to all 117 flashcards in this deck.
Unlock Deck
k this deck
35
Use the figure below to answer the following questions.
Figure 19.1.3
In Figure 19.1.3,the second richest 20 percent of all families receive what share of income?
A)10 percent
B)20 percent
C)30 percent
D)40 percent
E)none of the above
Figure 19.1.3In Figure 19.1.3,the second richest 20 percent of all families receive what share of income?
A)10 percent
B)20 percent
C)30 percent
D)40 percent
E)none of the above
Unlock Deck
Unlock for access to all 117 flashcards in this deck.
Unlock Deck
k this deck
36
The Gini coefficient for a perfectly equal distribution of income is
A)equal to zero.
B)equal to 1.
C)equal to 100.
D)equal to infinity.
E)negative.
A)equal to zero.
B)equal to 1.
C)equal to 100.
D)equal to infinity.
E)negative.
Unlock Deck
Unlock for access to all 117 flashcards in this deck.
Unlock Deck
k this deck
37
Consider the Lorenz curves in Figure 19.1.2.Which point indicates that the poorest 20 percent of families earn 9 percent of the income?
A)a
B)b
C)c
D)d
E)none of the above
A)a
B)b
C)c
D)d
E)none of the above
Unlock Deck
Unlock for access to all 117 flashcards in this deck.
Unlock Deck
k this deck
38
Use the figure below to answer the following questions.
Figure 19.1.3
In Figure 19.1.3,the middle 20 percent of all families receive what share of income?
A)10 percent
B)20 percent
C)30 percent
D)40 percent
E)none of the above
Figure 19.1.3In Figure 19.1.3,the middle 20 percent of all families receive what share of income?
A)10 percent
B)20 percent
C)30 percent
D)40 percent
E)none of the above
Unlock Deck
Unlock for access to all 117 flashcards in this deck.
Unlock Deck
k this deck
39
Consider the Lorenz curves in Figure 19.1.2.Which point indicates that the richest 20 percent of families earn 60 percent of the income?
A)a
B)b
C)c
D)d
E)none of the above
A)a
B)b
C)c
D)d
E)none of the above
Unlock Deck
Unlock for access to all 117 flashcards in this deck.
Unlock Deck
k this deck
40
Refer to Figure 19.1.2.What is curve A called?
A)market distribution line
B)line of equality
C)fairness line
D)low-income cut-off line
E)none of the above
A)market distribution line
B)line of equality
C)fairness line
D)low-income cut-off line
E)none of the above
Unlock Deck
Unlock for access to all 117 flashcards in this deck.
Unlock Deck
k this deck
41
Measured wealth distributions that do not consider the distribution of human capital
A)overstate the equality of the income distribution.
B)understate the inequality of the income distribution.
C)are correct since human capital is difficult to accurately measure.
D)overstate the inequality of the wealth distribution.
E)are correct because the distribution of human capital is about the same as the distribution of non-human wealth.
Unlock Deck
Unlock for access to all 117 flashcards in this deck.
Unlock Deck
k this deck
42
The demand for low-skilled labour is derived from the
A)work left undone by the high-skilled workers.
B)marginal cost of production.
C)lower wage rate of the labour.
D)supply of the high-skilled labourers.
E)value of marginal product of low-skilled labour.
A)work left undone by the high-skilled workers.
B)marginal cost of production.
C)lower wage rate of the labour.
D)supply of the high-skilled labourers.
E)value of marginal product of low-skilled labour.
Unlock Deck
Unlock for access to all 117 flashcards in this deck.
Unlock Deck
k this deck
43
Refer to Figure 19.3.1.At the equilibrium wage rates,
A)more high-skilled workers will be hired than low-skilled workers.
B)more low-skilled workers will be hired than high-skilled workers.
C)the horizontal distance between the two demand curves is the compensation for the cost of acquiring human capital.
D)the horizontal distance between the two supply curves is the value of marginal product of skill.
E)none of the above.
Unlock Deck
Unlock for access to all 117 flashcards in this deck.
Unlock Deck
k this deck
44
The demand for high-skilled labour is derived from the
A)exploitation of the low-skilled workers.
B)marginal cost of production.
C)lower wage of the labour.
D)supply of the high-skilled labourers.
E)value of marginal product of high-skilled labour.
A)exploitation of the low-skilled workers.
B)marginal cost of production.
C)lower wage of the labour.
D)supply of the high-skilled labourers.
E)value of marginal product of high-skilled labour.
Unlock Deck
Unlock for access to all 117 flashcards in this deck.
Unlock Deck
k this deck
45
If the supply of labour curve is upward sloping but not vertical,and if the value of marginal product of labour increases,
A)the supply of labour increases.
B)the wage rate rises.
C)the marginal cost of production increases.
D)the exploitation of workers decreases.
E)employment is unchanged.
A)the supply of labour increases.
B)the wage rate rises.
C)the marginal cost of production increases.
D)the exploitation of workers decreases.
E)employment is unchanged.
Unlock Deck
Unlock for access to all 117 flashcards in this deck.
Unlock Deck
k this deck
46
The world distribution of income has become more equal since 1970 because
A)average incomes in poorer countries are rising much faster than average incomes in rich countries.
B)the distribution of income within most countries has become more equal.
C)foreign aid programs from rich nations have increased in size and especially in effectiveness.
D)technology is used similarly in all countries.
E)all of the above
Unlock Deck
Unlock for access to all 117 flashcards in this deck.
Unlock Deck
k this deck
47
Use the figure below to answer the following questions.
Figure 19.3.1
Refer to Figure 19.2.1.For any given quantity of labour employed,
A)the elasticity of demand for high-skilled labourers is less than the elasticity of demand for low-skilled labourers.
B)high-skilled labourers will receive a lower wage than low-skilled labourers.
C)high-skilled labourers will receive a greater wage than low-skilled labourers.
D)the vertical distance between the two demand curves is the compensation for the cost of acquiring the skill.
E)the vertical distance between the two curves is the present value of human capital.
Figure 19.3.1Refer to Figure 19.2.1.For any given quantity of labour employed,
A)the elasticity of demand for high-skilled labourers is less than the elasticity of demand for low-skilled labourers.
B)high-skilled labourers will receive a lower wage than low-skilled labourers.
C)high-skilled labourers will receive a greater wage than low-skilled labourers.
D)the vertical distance between the two demand curves is the compensation for the cost of acquiring the skill.
E)the vertical distance between the two curves is the present value of human capital.
Unlock Deck
Unlock for access to all 117 flashcards in this deck.
Unlock Deck
k this deck
48
Use the figure below to answer the following questions.
Figure 19.3.1
Refer to Figure 19.3.1.At any given employment level,the vertical distance between the demand curves of the high-skilled and low-skilled workers
A)is equal to the difference in the value of marginal product of the workers.
B)is equal to the difference in the work ethic of the workers.
C)is caused by discrimination against minorities.
D)is caused by discrimination against women.
E)equals the cost of acquiring the skills.
Figure 19.3.1Refer to Figure 19.3.1.At any given employment level,the vertical distance between the demand curves of the high-skilled and low-skilled workers
A)is equal to the difference in the value of marginal product of the workers.
B)is equal to the difference in the work ethic of the workers.
C)is caused by discrimination against minorities.
D)is caused by discrimination against women.
E)equals the cost of acquiring the skills.
Unlock Deck
Unlock for access to all 117 flashcards in this deck.
Unlock Deck
k this deck
49
The greater the value of marginal product of labour,
A)the greater is the supply of labour.
B)the greater is the demand for labour.
C)the greater is the marginal cost of production.
D)the greater is unemployment.
E)the lower is the wage rate.
A)the greater is the supply of labour.
B)the greater is the demand for labour.
C)the greater is the marginal cost of production.
D)the greater is unemployment.
E)the lower is the wage rate.
Unlock Deck
Unlock for access to all 117 flashcards in this deck.
Unlock Deck
k this deck
50
Between 1980 and 2000,the world Gini ratio ________ indicating ________ in the world distribution of income.
A)fell;greater equality
B)fell;greater inequality
C)did not change;no change
D)rose;greater equality
E)rose;greater inequality
A)fell;greater equality
B)fell;greater inequality
C)did not change;no change
D)rose;greater equality
E)rose;greater inequality
Unlock Deck
Unlock for access to all 117 flashcards in this deck.
Unlock Deck
k this deck
51
Among Canada,Finland,and South Africa,income is distributed most equally in ________ and least equally in ________.
A)South Africa;Finland
B)Canada;South Africa
C)South Africa;Canada
D)Finland;Canada
E)Finland;South Africa
A)South Africa;Finland
B)Canada;South Africa
C)South Africa;Canada
D)Finland;Canada
E)Finland;South Africa
Unlock Deck
Unlock for access to all 117 flashcards in this deck.
Unlock Deck
k this deck
52
The distribution of wealth
A)understates the degree of inequality because it does not take into account the family's stage in its life cycle.
B)understates the degree of inequality because it does not take into account the distribution of human capital.
C)overstates the degree of inequality because it does not take into account the family's stage in its life cycle.
D)overstates the degree of inequality because it does not take into account the distribution of human capital.
E)is an accurate measure of the degree of inequality.
Unlock Deck
Unlock for access to all 117 flashcards in this deck.
Unlock Deck
k this deck
53
Use the figure below to answer the following questions.
Figure 19.3.2
Refer to Figure 19.3.2.At an employment level of 40 hours per week,the difference in the value of marginal product of high-skilled workers and low-skilled workers is
A)$0.
B)$2 an hour.
C)$6 an hour.
D)$4 an hour.
E)$3 an hour.
Figure 19.3.2Refer to Figure 19.3.2.At an employment level of 40 hours per week,the difference in the value of marginal product of high-skilled workers and low-skilled workers is
A)$0.
B)$2 an hour.
C)$6 an hour.
D)$4 an hour.
E)$3 an hour.
Unlock Deck
Unlock for access to all 117 flashcards in this deck.
Unlock Deck
k this deck
54
The vertical distance between the two supply curves in Figure 19.3.1
A)is the compensation for the cost of acquiring human capital.
B)is the VMP of skill.
C)is the result of discrimination against low-skilled workers.
D)is the result of subsidies for high-skilled workers.
E)will disappear if there is free entry in the high-skilled market.
A)is the compensation for the cost of acquiring human capital.
B)is the VMP of skill.
C)is the result of discrimination against low-skilled workers.
D)is the result of subsidies for high-skilled workers.
E)will disappear if there is free entry in the high-skilled market.
Unlock Deck
Unlock for access to all 117 flashcards in this deck.
Unlock Deck
k this deck
55
Incomes in China and India are a small fraction of incomes in Canada.But incomes in China and India are growing at more than twice the rate of those in Canada.As a result,the inequality in income between the people in China and India and people in Canada is ________ and the world Gini ratio is ________.
A)staying relatively constant;remaining constant
B)increasing in some years and decreasing in other years;remaining constant
C)decreasing;decreasing
D)increasing;increasing
E)decreasing;increasing
A)staying relatively constant;remaining constant
B)increasing in some years and decreasing in other years;remaining constant
C)decreasing;decreasing
D)increasing;increasing
E)decreasing;increasing
Unlock Deck
Unlock for access to all 117 flashcards in this deck.
Unlock Deck
k this deck
56
The distribution of annual income
A)understates the degree of inequality because it does not take into account the family's stage in its life cycle.
B)understates the degree of inequality because it does not take into account the distribution of human capital.
C)overstates the degree of inequality because it does not take into account the family's stage in its life cycle.
D)overstates the degree of inequality because it does not take into account the distribution of human capital.
E)is an accurate measure of the degree of inequality.
Unlock Deck
Unlock for access to all 117 flashcards in this deck.
Unlock Deck
k this deck
57
Refer only to the information in Figure 19.3.1.At any given wage rate,
A)more hours of low-skilled labour will be demanded than high-skilled labour.
B)more hours of high-skilled labour will be demanded than low-skilled labour.
C)more hours of low-skilled labour will be supplied than high-skilled labour.
D)more hours of high-skilled labour will be supplied than low-skilled labour.
E)both B and C are correct.
Unlock Deck
Unlock for access to all 117 flashcards in this deck.
Unlock Deck
k this deck
58
The distribution of world income is ________ the distribution of Canadian income.
A)more equal than
B)equal to
C)not comparable to
D)equal to the distribution of Canadian wealth and more equal than
E)less equal than
A)more equal than
B)equal to
C)not comparable to
D)equal to the distribution of Canadian wealth and more equal than
E)less equal than
Unlock Deck
Unlock for access to all 117 flashcards in this deck.
Unlock Deck
k this deck
59
Use the figure below to answer the following questions.
Figure 19.3.2
Refer to Figure 19.3.2.At an employment level of 20 hours per week,firms are willing to pay
A)a wage rate of $7 an hour to low-skilled workers.
B)a maximum of $5 an hour to high-skilled workers.
C)up to $7 an hour for high-skilled workers.
D)the same for high-skilled workers as for low-skilled workers.
E)$3 an hour more for high-skilled workers.
Figure 19.3.2Refer to Figure 19.3.2.At an employment level of 20 hours per week,firms are willing to pay
A)a wage rate of $7 an hour to low-skilled workers.
B)a maximum of $5 an hour to high-skilled workers.
C)up to $7 an hour for high-skilled workers.
D)the same for high-skilled workers as for low-skilled workers.
E)$3 an hour more for high-skilled workers.
Unlock Deck
Unlock for access to all 117 flashcards in this deck.
Unlock Deck
k this deck
60
Wealth differs from income because
A)income is a stock and wealth is a flow.
B)wealth is derived from income.
C)income is what you earn and wealth is what you own.
D)income is what you own and wealth is what you earn.
E)wealth is preferable to income.
A)income is a stock and wealth is a flow.
B)wealth is derived from income.
C)income is what you earn and wealth is what you own.
D)income is what you own and wealth is what you earn.
E)wealth is preferable to income.
Unlock Deck
Unlock for access to all 117 flashcards in this deck.
Unlock Deck
k this deck
61
Use the figure below to answer the following question.
Figure 19.3.4
Refer to Figure 19.3.4.At an employment level of 30 hours per week,the compensation required for the cost of acquiring human capital is
A)$0.
B)$2 an hour.
C)$4 an hour.
D)$6 an hour.
E)cannot be determined without knowing the demand for labour.
Figure 19.3.4Refer to Figure 19.3.4.At an employment level of 30 hours per week,the compensation required for the cost of acquiring human capital is
A)$0.
B)$2 an hour.
C)$4 an hour.
D)$6 an hour.
E)cannot be determined without knowing the demand for labour.
Unlock Deck
Unlock for access to all 117 flashcards in this deck.
Unlock Deck
k this deck
62
Refer to Figure 19.3.5.This figure shows the labour supply curves and the value of marginal product curves for high-skilled and low-skilled workers.If there is an increase in the supply of high-skilled workers and the supply of high-skilled workers is now equal to the supply of low-skilled workers,then employment of high-skilled labour would
A)remain the same.
B)decrease.
C)increase to 40 hours per week.
D)increase to 50 hours per week.
E)none of the above.
A)remain the same.
B)decrease.
C)increase to 40 hours per week.
D)increase to 50 hours per week.
E)none of the above.
Unlock Deck
Unlock for access to all 117 flashcards in this deck.
Unlock Deck
k this deck
63
If discrimination takes the form of consumers discriminating against a group of workers,the effect on this group of workers will be to shift their
A)value of marginal product curve rightward and increase their wage rate.
B)value of marginal product curve leftward and decrease their wage rate.
C)value of marginal product curve rightward and decrease their wage rate.
D)supply of labour curve leftward and increase their wage rate.
E)supply of labour curve rightward and decrease their wage rate.
Unlock Deck
Unlock for access to all 117 flashcards in this deck.
Unlock Deck
k this deck
64
Complete the following sentence.Passing on wealth from one generation to another
A)can decrease the inequality of wealth.
B)will decrease the inequality of income.
C)is limited since the government taxes this at a very high marginal tax rate.
D)is one of the main causes of social unrest.
E)will make the distribution of wealth more closely match the distribution of human capital.
Unlock Deck
Unlock for access to all 117 flashcards in this deck.
Unlock Deck
k this deck
65
Which of the following statements is false? Human capital
A)is the accumulated skill and knowledge of human beings.
B)is costly to acquire.
C)increases from on-the-job training.
D)increases from higher wages.
E)increases from education.
A)is the accumulated skill and knowledge of human beings.
B)is costly to acquire.
C)increases from on-the-job training.
D)increases from higher wages.
E)increases from education.
Unlock Deck
Unlock for access to all 117 flashcards in this deck.
Unlock Deck
k this deck
66
One important source of earnings differentials is the
A)style of dress of the employee.
B)hair colour of the employee.
C)type of car driven by the employee.
D)number of years it takes the employee to graduate from college.
E)education level of the employee.
A)style of dress of the employee.
B)hair colour of the employee.
C)type of car driven by the employee.
D)number of years it takes the employee to graduate from college.
E)education level of the employee.
Unlock Deck
Unlock for access to all 117 flashcards in this deck.
Unlock Deck
k this deck
67
Use the figure below to answer the following questions.
Figure 19.3.2
Refer to Figure 19.3.2.At a wage rate of $5,an employer would hire
A)the same amount of high-skilled workers and low-skilled workers.
B)20 hours of low-skilled labour and 40 hours of high-skilled labour.
C)60 hours of low-skilled labour and 20 hours of high-skilled labour.
D)20 hours of low-skilled labour and 60 hours of high-skilled labour.
E)40 hours of low-skilled labour and 60 hours of high-skilled labour.
Figure 19.3.2Refer to Figure 19.3.2.At a wage rate of $5,an employer would hire
A)the same amount of high-skilled workers and low-skilled workers.
B)20 hours of low-skilled labour and 40 hours of high-skilled labour.
C)60 hours of low-skilled labour and 20 hours of high-skilled labour.
D)20 hours of low-skilled labour and 60 hours of high-skilled labour.
E)40 hours of low-skilled labour and 60 hours of high-skilled labour.
Unlock Deck
Unlock for access to all 117 flashcards in this deck.
Unlock Deck
k this deck
68
A generation that is wealthy and leaves assets to another generation that is not wealthy
A)increases the inequality of the income distribution.
B)decreases the inequality of the income distribution.
C)does not change the distribution of income.
D)proves that inheritance taxes are needed.
E)is improving efficiency.
A)increases the inequality of the income distribution.
B)decreases the inequality of the income distribution.
C)does not change the distribution of income.
D)proves that inheritance taxes are needed.
E)is improving efficiency.
Unlock Deck
Unlock for access to all 117 flashcards in this deck.
Unlock Deck
k this deck
69
Use the figure below to answer the following questions.
Figure 19.3.5
Refer to Figure 19.3.5.This figure shows the labour supply curves and the value of marginal product curves for high-skilled and low-skilled workers.The equilibrium wage rate for high-skilled workers is
A)$5 an hour.
B)$4 an hour.
C)$6 an hour.
D)$8 an hour.
E)$7 an hour.
Figure 19.3.5Refer to Figure 19.3.5.This figure shows the labour supply curves and the value of marginal product curves for high-skilled and low-skilled workers.The equilibrium wage rate for high-skilled workers is
A)$5 an hour.
B)$4 an hour.
C)$6 an hour.
D)$8 an hour.
E)$7 an hour.
Unlock Deck
Unlock for access to all 117 flashcards in this deck.
Unlock Deck
k this deck
70
Use the figure below to answer the following questions.
Figure 19.3.6
Refer to Figure 19.3.6.If this is the market for a group of workers who are discriminated against by customers and point A represents the equilibrium without discrimination,which point represents the equilibrium for the workers who are discriminated against?
A)D
B)B
C)I
D)C
E)H
Figure 19.3.6Refer to Figure 19.3.6.If this is the market for a group of workers who are discriminated against by customers and point A represents the equilibrium without discrimination,which point represents the equilibrium for the workers who are discriminated against?
A)D
B)B
C)I
D)C
E)H
Unlock Deck
Unlock for access to all 117 flashcards in this deck.
Unlock Deck
k this deck
71
Use the figure below to answer the following questions.
Figure 19.3.5
Refer to Figure 19.3.5.This figure shows the labour supply curves and the value of marginal product curves for high-skilled and low-skilled workers.The equilibrium wage rate for low-skilled workers is
A)$3 an hour.
B)$7 an hour.
C)$6 an hour.
D)$5 an hour.
E)$4 an hour.
Figure 19.3.5Refer to Figure 19.3.5.This figure shows the labour supply curves and the value of marginal product curves for high-skilled and low-skilled workers.The equilibrium wage rate for low-skilled workers is
A)$3 an hour.
B)$7 an hour.
C)$6 an hour.
D)$5 an hour.
E)$4 an hour.
Unlock Deck
Unlock for access to all 117 flashcards in this deck.
Unlock Deck
k this deck
72
Use the figure below to answer the following question.
Figure 19.3.3
Refer to Figure 19.3.3.At any given level of employment for high-skilled and low-skilled workers,the vertical distance between the two supply curves
A)disappears if there is free entry into the skill market.
B)disappears if there is equal pay for work of equal value.
C)is created by discrimination against low-skilled workers.
D)is the compensation required for the cost of acquiring human capital.
E)equals the value of marginal product of skill.
Figure 19.3.3Refer to Figure 19.3.3.At any given level of employment for high-skilled and low-skilled workers,the vertical distance between the two supply curves
A)disappears if there is free entry into the skill market.
B)disappears if there is equal pay for work of equal value.
C)is created by discrimination against low-skilled workers.
D)is the compensation required for the cost of acquiring human capital.
E)equals the value of marginal product of skill.
Unlock Deck
Unlock for access to all 117 flashcards in this deck.
Unlock Deck
k this deck
73
Other things remaining the same,if education costs rise substantially,we would expect to see
A)a decrease in the value of marginal product of high-skilled workers.
B)a decrease in the demand for high-skilled workers.
C)an increase in the supply of high-skilled workers.
D)an increase in the number of high-skilled workers employed.
E)an increase in the wages received by high-skilled workers.
A)a decrease in the value of marginal product of high-skilled workers.
B)a decrease in the demand for high-skilled workers.
C)an increase in the supply of high-skilled workers.
D)an increase in the number of high-skilled workers employed.
E)an increase in the wages received by high-skilled workers.
Unlock Deck
Unlock for access to all 117 flashcards in this deck.
Unlock Deck
k this deck
74
Which one of the following is not a reason why the wages of high-skilled workers exceed the wages of low-skilled workers?
A)The market for high-skilled workers is more competitive than the market for low-skilled labour.
B)The value of marginal product of high-skilled workers is greater than that of low-skilled workers.
C)The cost of obtaining the human capital required for high-skilled workers is greater than the cost of obtaining the human capital required for low-skilled workers.
D)High-skilled workers have acquired more human capital than low-skilled workers.
E)The demand curve for high-skilled workers lies to the right of the demand curve for low-skilled workers.
Unlock Deck
Unlock for access to all 117 flashcards in this deck.
Unlock Deck
k this deck
75
Assortative mating means that
A)poor men tend to marry rich women.
B)people tend to marry within their own socioeconomic class.
C)people tend to marry above their own socioeconomic class.
D)same sex marriages occur because "like attracts like."
E)people with different values will marry.
A)poor men tend to marry rich women.
B)people tend to marry within their own socioeconomic class.
C)people tend to marry above their own socioeconomic class.
D)same sex marriages occur because "like attracts like."
E)people with different values will marry.
Unlock Deck
Unlock for access to all 117 flashcards in this deck.
Unlock Deck
k this deck
76
Use the figure below to answer the following questions.
Figure 19.3.5
Refer to Figure 19.3.5.This figure shows the labour supply curves and the value of marginal product curves for high-skilled and low-skilled workers.If there is an increase in the supply of high-skilled workers and the supply of high-skilled workers is now equal to the supply of low-skilled workers,then
A)wages paid to high-skilled workers would fall to $4 an hour.
B)wages paid to high-skilled workers would fall to $5 an hour.
C)wages paid to high-skilled workers would fall to $6 an hour.
D)there would be no change in the wages of high-skilled workers,because high-skilled workers always earn more than low-skilled workers.
E)there would be no change in the wages of high-skilled workers,because their value of marginal product is unchanged.
Figure 19.3.5Refer to Figure 19.3.5.This figure shows the labour supply curves and the value of marginal product curves for high-skilled and low-skilled workers.If there is an increase in the supply of high-skilled workers and the supply of high-skilled workers is now equal to the supply of low-skilled workers,then
A)wages paid to high-skilled workers would fall to $4 an hour.
B)wages paid to high-skilled workers would fall to $5 an hour.
C)wages paid to high-skilled workers would fall to $6 an hour.
D)there would be no change in the wages of high-skilled workers,because high-skilled workers always earn more than low-skilled workers.
E)there would be no change in the wages of high-skilled workers,because their value of marginal product is unchanged.
Unlock Deck
Unlock for access to all 117 flashcards in this deck.
Unlock Deck
k this deck
77
Use the figure below to answer the following questions.
Figure 19.3.5
Refer to Figure 19.3.5.This figure shows the labour supply curves and the value of marginal product curves for high-skilled and low-skilled workers.If the labour markets are competitive,then for a 40-hour work week,high-skilled workers must be paid
A)an extra $3 to compensate for the cost of acquiring their human capital and for their increased productivity.
B)an extra $20 to compensate for the cost of acquiring their human capital and for their increased productivity.
C)an extra $120 to compensate for the cost of acquiring their human capital and for their increased productivity.
D)an extra $300 to compensate for the cost of acquiring their human capital and for their enhanced productivity.
E)an extra $180 to compensate for the cost of acquiring their human capital and for their increased productivity.
Figure 19.3.5Refer to Figure 19.3.5.This figure shows the labour supply curves and the value of marginal product curves for high-skilled and low-skilled workers.If the labour markets are competitive,then for a 40-hour work week,high-skilled workers must be paid
A)an extra $3 to compensate for the cost of acquiring their human capital and for their increased productivity.
B)an extra $20 to compensate for the cost of acquiring their human capital and for their increased productivity.
C)an extra $120 to compensate for the cost of acquiring their human capital and for their increased productivity.
D)an extra $300 to compensate for the cost of acquiring their human capital and for their enhanced productivity.
E)an extra $180 to compensate for the cost of acquiring their human capital and for their increased productivity.
Unlock Deck
Unlock for access to all 117 flashcards in this deck.
Unlock Deck
k this deck
78
Which of the following three statements is true? Human capital
A)decreases your value of marginal product.
B)lowers your wages.
C)may reduce your income while you are accumulating it.
D)All of the above statements are true.
E)None of the above three statements are true.
A)decreases your value of marginal product.
B)lowers your wages.
C)may reduce your income while you are accumulating it.
D)All of the above statements are true.
E)None of the above three statements are true.
Unlock Deck
Unlock for access to all 117 flashcards in this deck.
Unlock Deck
k this deck
79
Complete the following sentence.Assortative mating
A)tends to breakdown barriers between the social classes.
B)tends to increase the equality of the income distribution.
C)tends to increase the equality of the distribution of wealth.
D)tends to keep the income and wealth distributions from becoming more equal.
E)occurs rarely these days due to changes in social values.
Unlock Deck
Unlock for access to all 117 flashcards in this deck.
Unlock Deck
k this deck
80
Use the figure below to answer the following questions.
Figure 19.3.2
Refer to Figure 19.3.2.For the employer to hire 40 hours per week of both high-skilled and low-skilled labour,
A)high-skilled workers would have to earn a wage rate that is twice that of the low-skilled workers.
B)high-skilled workers would have to earn a wage rate that is less than that of the low-skilled workers.
C)high-skilled workers would have to earn a wage that is $2 more than the wage paid to low-skilled workers.
D)low-skilled workers would have to earn a wage that is $2 more than the wage paid to high-skilled workers.
E)high-skilled workers need to earn a wage that is between zero and $2 more than low-skilled workers.
Figure 19.3.2Refer to Figure 19.3.2.For the employer to hire 40 hours per week of both high-skilled and low-skilled labour,
A)high-skilled workers would have to earn a wage rate that is twice that of the low-skilled workers.
B)high-skilled workers would have to earn a wage rate that is less than that of the low-skilled workers.
C)high-skilled workers would have to earn a wage that is $2 more than the wage paid to low-skilled workers.
D)low-skilled workers would have to earn a wage that is $2 more than the wage paid to high-skilled workers.
E)high-skilled workers need to earn a wage that is between zero and $2 more than low-skilled workers.
Unlock Deck
Unlock for access to all 117 flashcards in this deck.
Unlock Deck
k this deck
Unlock Deck
Unlock for access to all 117 flashcards in this deck.


