Exam 19: Economic Inequality
Exam 1: What Is Economics198 Questions
Exam 2: The Economic Problem143 Questions
Exam 3: Demand and Supply178 Questions
Exam 4: Elasticity168 Questions
Exam 5: Efficiency and Equity110 Questions
Exam 6: Government Actions in Markets119 Questions
Exam 7: Global Markets in Action129 Questions
Exam 8: Utility and Demand110 Questions
Exam 9: Possibilities,preferences,and Choices113 Questions
Exam 10: Organizing Production104 Questions
Exam 11: Output and Costs133 Questions
Exam 12: Perfect Competition118 Questions
Exam 13: Monopoly107 Questions
Exam 14: Monopolistic Competition111 Questions
Exam 15: Oligopoly97 Questions
Exam 16: Externalities111 Questions
Exam 17: Public Goods and Common Resources89 Questions
Exam 18: Markets for Factors of Production119 Questions
Exam 19: Economic Inequality117 Questions
Select questions type
The vertical distance between the two supply curves in Figure 19.3.1
Free
(Multiple Choice)
4.7/5  (41)
(41)
Correct Answer: Verified
A
Refer to the table below to answer the following questions.
Table 19.4.2
Before -tax income (dollars) Plan A tax (dollars) Plan B tax (dollars) Plan C tax (dollars) 1,000 1,000 2,000 2,000 4,000 2,000 3,000 9,000 2,000
-Refer to Table 19.4.2.The table shows three tax payment schemes.Which tax payment plan reduces inequality?
Free
(Multiple Choice)
4.8/5 (24)
Correct Answer:Verified
D
Use the figure below to answer the following question.
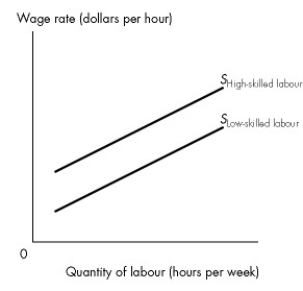 Figure 19.3.3
-Refer to Figure 19.3.3.At any given level of employment for high-skilled and low-skilled workers,the vertical distance between the two supply curves
Figure 19.3.3
-Refer to Figure 19.3.3.At any given level of employment for high-skilled and low-skilled workers,the vertical distance between the two supply curves
Free
(Multiple Choice)
5.0/5 (41)
Correct Answer:Verified
D
Use the figure below to answer the following questions.
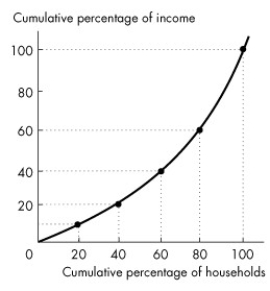 Figure 19.1.3
-In Figure 19.1.3,the poorest 20 percent of all families receive what share of income?
Figure 19.1.3
-In Figure 19.1.3,the poorest 20 percent of all families receive what share of income?
(Multiple Choice)
4.8/5 (26)
Last year you earned $45,000 and paid $9,000 in income taxes.This year you earned $60,000 and paid $15,000 in income taxes.What type of income tax do you face?
(Multiple Choice)
4.9/5 (31)
The distribution of world income is ________ the distribution of Canadian income.
(Multiple Choice)
4.7/5 (41)
Complete the following sentence.Passing on wealth from one generation to another
(Multiple Choice)
4.8/5 (36)
A firm that discriminates has ________ a firm that does not discriminate and ________.
(Multiple Choice)
4.8/5 (29)
Use the figure below to answer the following questions.
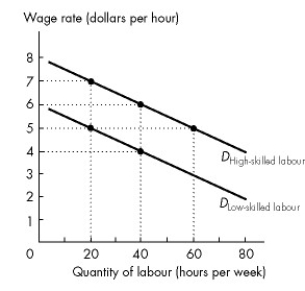 Figure 19.3.2
-Refer to Figure 19.3.2.At an employment level of 40 hours per week,the difference in the value of marginal product of high-skilled workers and low-skilled workers is
Figure 19.3.2
-Refer to Figure 19.3.2.At an employment level of 40 hours per week,the difference in the value of marginal product of high-skilled workers and low-skilled workers is
(Multiple Choice)
4.8/5 (33)
Use the figure below to answer the following questions.
 Figure 19.3.1
-Refer to Figure 19.2.1.For any given quantity of labour employed,
Figure 19.3.1
-Refer to Figure 19.2.1.For any given quantity of labour employed,
(Multiple Choice)
4.8/5 (40)
Which point in Figure 19.1.2 indicates that the richest 20 percent of families earn 40 percent of the income?
(Multiple Choice)
4.9/5 (46)
Use the figure below to answer the following questions.
Figure 19.1.3
-In Figure 19.1.3,the middle 20 percent of all families receive what share of income?
(Multiple Choice)
4.9/5 (30)
In 2009,what percentage of households received the mode income in Canada?
(Multiple Choice)
4.7/5 (39)
Use the figure below to answer the following questions.
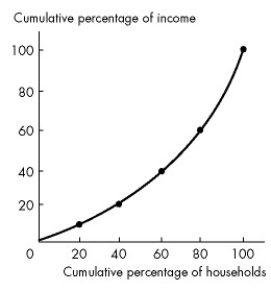 Figure 19.1.1
-Refer to Figure 19.11.The middle 20 percent of households receive what share of total income?
Figure 19.1.1
-Refer to Figure 19.11.The middle 20 percent of households receive what share of total income?
(Multiple Choice)
4.7/5 (27)
The three main avenues through which the government redistributes income are
(Multiple Choice)
4.8/5 (37)
Use the figure below to answer the following questions.
Figure 19.3.2
-Refer to Figure 19.3.2.For the employer to hire 40 hours per week of both high-skilled and low-skilled labour,
(Multiple Choice)
4.7/5 (37)
Use the figure below to answer the following questions.
Figure 19.1.3
-The curve in Figure 19.1.3 is the
(Multiple Choice)
4.8/5 (38)
Technological change ________ the demand for high-skilled workers and ________ the demand for low-skilled workers.As a result,income inequality ________.
(Multiple Choice)
4.9/5 (31)
Filters
- Essay(0)
- Multiple Choice(0)
- Short Answer(0)
- True False(0)
- Matching(0)