Deck 17: The Economics of Environmental Protection
Full screen (f)
Question
Question
Question
The figure below shows the marginal benefit to consumers,MB,the marginal cost to private firms,MCP,and the marginal cost to society,MCS,at each level of output of some good.
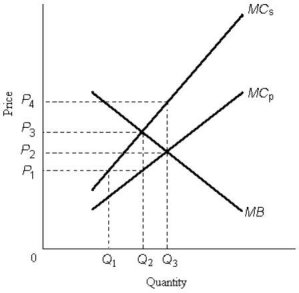 FIGURE 17-1
Refer to Figure 17-1.A negative externality is depicted because the
A)marginal social cost is greater than the marginal social benefit.
B)marginal social cost is greater than the marginal private cost.
C)marginal social benefit to consumers is diminishing with greater output.
D)optimal level of output occurs where marginal private cost is positive.
E)optimal level of output occurs where marginal private benefit is positive.
FIGURE 17-1Refer to Figure 17-1.A negative externality is depicted because the
A)marginal social cost is greater than the marginal social benefit.
B)marginal social cost is greater than the marginal private cost.
C)marginal social benefit to consumers is diminishing with greater output.
D)optimal level of output occurs where marginal private cost is positive.
E)optimal level of output occurs where marginal private benefit is positive.
Question
The figure below shows the marginal benefit to consumers,MB,the marginal cost to private firms,MCP,and the marginal cost to society,MCS,at each level of output of some good.
FIGURE 17-1
Refer to Figure 17-1.The price that leads consumers to demand the socially optimal quantity of output is
A)zero.
B)P1.
C)P2.
D)P3.
E)not possible to know from the information given.
FIGURE 17-1Refer to Figure 17-1.The price that leads consumers to demand the socially optimal quantity of output is
A)zero.
B)P1.
C)P2.
D)P3.
E)not possible to know from the information given.
Question
Question
Question
Question
Question
Question
Question
Question
Question
Question
The figure below shows the marginal benefit to consumers,MB,the marginal cost to private firms,MCP,and the marginal cost to society,MCS,at each level of output of some good.
FIGURE 17-1
Refer to Figure 17-1.What is the marginal external cost at output level Q3?
A)P1
B)P2
C)P4
D)P4 - P2
E)P3 - P1
FIGURE 17-1Refer to Figure 17-1.What is the marginal external cost at output level Q3?
A)P1
B)P2
C)P4
D)P4 - P2
E)P3 - P1
Question
The figure below shows the marginal benefit to consumers,MB,the marginal cost to private firms,MCP,and the marginal cost to society,MCS,at each level of output of some good.
FIGURE 17-1
Refer to Figure 17-1.The price that would occur in a competitive market in the absence of government intervention is
A)P1.
B)P2.
C)P3.
D)P4.
E)not possible to know from the information given.
FIGURE 17-1Refer to Figure 17-1.The price that would occur in a competitive market in the absence of government intervention is
A)P1.
B)P2.
C)P3.
D)P4.
E)not possible to know from the information given.
Question
Question
Question
Question
The figure below shows the marginal benefit to consumers,MB,the marginal cost to private firms,MCP,and the marginal cost to society,MCS,at each level of output of some good.
FIGURE 17-1
Refer to Figure 17-1.The equilibrium output that would occur in a competitive market in the absence of government intervention is
A)zero.
B)Q1.
C)Q2.
D)Q3.
E)none of the above; there is no equilibrium output level.
FIGURE 17-1Refer to Figure 17-1.The equilibrium output that would occur in a competitive market in the absence of government intervention is
A)zero.
B)Q1.
C)Q2.
D)Q3.
E)none of the above; there is no equilibrium output level.
Question
The figure below shows the marginal benefit to consumers,MB,the marginal cost to private firms,MCP,and the marginal cost to society,MCS,at each level of output of some good.
FIGURE 17-1
Refer to Figure 17-1.The socially optimal level of output is
A)zero.
B)Q1.
C)Q2.
D)Q3.
E)none of the above; there is no optimal output level.
FIGURE 17-1Refer to Figure 17-1.The socially optimal level of output is
A)zero.
B)Q1.
C)Q2.
D)Q3.
E)none of the above; there is no optimal output level.
Question
Question
Question
The diagram below shows the private and social marginal costs (MCP and MCS)and the social marginal benefits (MBS)of producing disposable diapers.
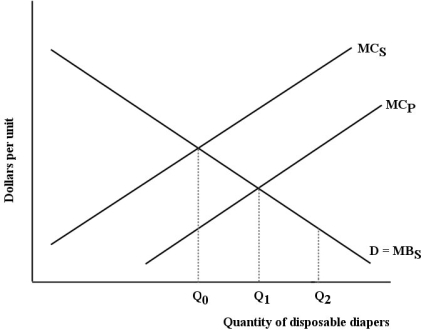 FIGURE 17-2
Refer to Figure 17-2.The allocatively efficient level of production and use of disposable diapers is
A)Q0,because that is where MCS exceeds MCP.
B)Q0,because that is where MCS equals MBS.
C)Q1,because that is where MCP equals MBS.
D)Q1,because that is where MCS equals MBS.
E)Q2,because that is where the externality is internalized.
FIGURE 17-2Refer to Figure 17-2.The allocatively efficient level of production and use of disposable diapers is
A)Q0,because that is where MCS exceeds MCP.
B)Q0,because that is where MCS equals MBS.
C)Q1,because that is where MCP equals MBS.
D)Q1,because that is where MCS equals MBS.
E)Q2,because that is where the externality is internalized.
Question
Question
Question
Question
Question
Question
Question
Question
Question
Question
Question
Question
Question
The diagram below shows the private and social marginal costs (MCP and MCS)and the social marginal benefits (MBS)of producing disposable diapers.
FIGURE 17-2
Refer to Figure 17-2.The net social benefit derived from the production and use of disposable diapers is
A)at a minimum at Q0,because MCS exceeds MCP.
B)at a maximum at Q0,because that is where MCS equals MBS.
C)at a maximum at Q1,because that is where MCS equals MBS.
D)zero at Q0,because that is where MCS equals MBS.
E)zero at Q2,because that is where the externality is internalized.
FIGURE 17-2Refer to Figure 17-2.The net social benefit derived from the production and use of disposable diapers is
A)at a minimum at Q0,because MCS exceeds MCP.
B)at a maximum at Q0,because that is where MCS equals MBS.
C)at a maximum at Q1,because that is where MCS equals MBS.
D)zero at Q0,because that is where MCS equals MBS.
E)zero at Q2,because that is where the externality is internalized.
Question
Question
Question
Question
The diagram below shows the private and social marginal costs (MCP and MCS)and the social marginal benefits (MBS)of producing disposable diapers.
FIGURE 17-2
Refer to Figure 17-2.The net social benefit derived from the production and use of the last unit of disposable diapers is
A)at a minimum at Q0,because MCS exceeds MCP.
B)at a maximum at Q0,because that is where MCS equals MBS.
C)at a maximum at Q1,because that is where MCS equals MBS.
D)zero at Q0,because that is where MCS equals MBS.
E)zero at Q2,because that is where the externality is fully maximized.
FIGURE 17-2Refer to Figure 17-2.The net social benefit derived from the production and use of the last unit of disposable diapers is
A)at a minimum at Q0,because MCS exceeds MCP.
B)at a maximum at Q0,because that is where MCS equals MBS.
C)at a maximum at Q1,because that is where MCS equals MBS.
D)zero at Q0,because that is where MCS equals MBS.
E)zero at Q2,because that is where the externality is fully maximized.
Question
The table below shows the marginal costs and marginal benefits associated with cleaning up a polluted landfill site. 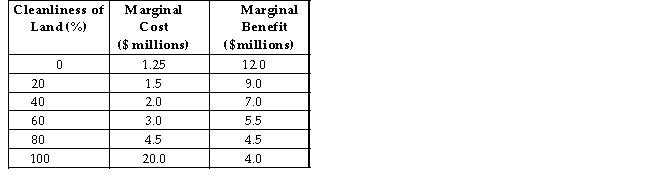 TABLE 17-2
Refer to Table 17-2.What is the maximum total net benefit to society that can be attained by cleaning this landfill site?
A)$41.25 million
B)$25.25 million
C)$4.5 million
D)$0
E)It is not possible to determine without knowing the precise MB and MC curves.
TABLE 17-2Refer to Table 17-2.What is the maximum total net benefit to society that can be attained by cleaning this landfill site?
A)$41.25 million
B)$25.25 million
C)$4.5 million
D)$0
E)It is not possible to determine without knowing the precise MB and MC curves.
Question
The figure below shows the demand and supply curves for pollution abatement.
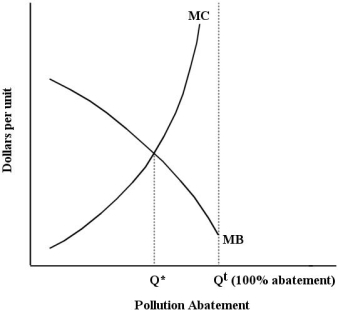 FIGURE 17-3
Refer to Figure 17-3.What area on the diagram represents the net total benefit of abating pollution by the optimal amount?
A)the area under the MB curve,and above the MC curve,to the left of Q*
B)the area above the MB curve,and below the MC curve,to the right of Q*
C)the area that is below both the MB and MC curves
D)the area that is above both the MB and MC curves
E)the total area below the MB curve,to the left of Q*
FIGURE 17-3Refer to Figure 17-3.What area on the diagram represents the net total benefit of abating pollution by the optimal amount?
A)the area under the MB curve,and above the MC curve,to the left of Q*
B)the area above the MB curve,and below the MC curve,to the right of Q*
C)the area that is below both the MB and MC curves
D)the area that is above both the MB and MC curves
E)the total area below the MB curve,to the left of Q*
Question
The table below shows the marginal costs and marginal benefits associated with cleaning up a polluted landfill site. TABLE 17-2
Refer to Table 17-2.Would it be socially optimal to achieve 100% cleanliness of this landfill site?
A)Yes,because 100% cleanliness of the land is the only socially optimal outcome.
B)No,because the technology for 100% cleanliness is not available.
C)No,because the net benefit to society at that level is not maximized.
D)Yes,because the net benefit to society at that level is positive.
E)Yes,because there is a $4.0 million marginal benefit of achieving 100% cleanliness.
TABLE 17-2Refer to Table 17-2.Would it be socially optimal to achieve 100% cleanliness of this landfill site?
A)Yes,because 100% cleanliness of the land is the only socially optimal outcome.
B)No,because the technology for 100% cleanliness is not available.
C)No,because the net benefit to society at that level is not maximized.
D)Yes,because the net benefit to society at that level is positive.
E)Yes,because there is a $4.0 million marginal benefit of achieving 100% cleanliness.
Question
The figure below shows the demand and supply curves for pollution abatement.
FIGURE 17-3
Refer to Figure 17-3.The socially optimal amount of pollution is
A)Q* + Qt.
B)Qt - Q*.
C)Q*.
D)Qt.
E)0.
FIGURE 17-3Refer to Figure 17-3.The socially optimal amount of pollution is
A)Q* + Qt.
B)Qt - Q*.
C)Q*.
D)Qt.
E)0.
Question
Question
The figure below shows the demand and supply curves for pollution abatement.
FIGURE 17-3
Refer to Figure 17-3.The MB curve in this diagram is downward sloping because
A)the marginal benefit from a given amount of abatement will be lower,the lower the level of pollution.
B)the marginal cost of additional units of pollution abatement is decreasing.
C)the marginal damage generated by additional units of pollution is decreasing.
D)the marginal benefit from a given amount of abatement will be higher,the higher the level of pollution abated.
E)the marginal cost of additional units of pollution abatement increases as pollution abatement increases.
FIGURE 17-3Refer to Figure 17-3.The MB curve in this diagram is downward sloping because
A)the marginal benefit from a given amount of abatement will be lower,the lower the level of pollution.
B)the marginal cost of additional units of pollution abatement is decreasing.
C)the marginal damage generated by additional units of pollution is decreasing.
D)the marginal benefit from a given amount of abatement will be higher,the higher the level of pollution abated.
E)the marginal cost of additional units of pollution abatement increases as pollution abatement increases.
Question
The figure below shows the demand and supply curves for pollution abatement.
FIGURE 17-3
Refer to Figure 17-3.The MC curve in this diagram is upward sloping because
A)the marginal benefit from a given amount of abatement will be lower,the lower the level of pollution.
B)the marginal cost of additional units of pollution abatement is decreasing.
C)the marginal damage generated by additional units of pollution is decreasing.
D)the marginal benefit from a given amount of abatement will be higher,the higher the level of pollution abated.
E)the marginal cost of additional units of pollution abatement increases as the total amount of remaining pollution declines.
FIGURE 17-3Refer to Figure 17-3.The MC curve in this diagram is upward sloping because
A)the marginal benefit from a given amount of abatement will be lower,the lower the level of pollution.
B)the marginal cost of additional units of pollution abatement is decreasing.
C)the marginal damage generated by additional units of pollution is decreasing.
D)the marginal benefit from a given amount of abatement will be higher,the higher the level of pollution abated.
E)the marginal cost of additional units of pollution abatement increases as the total amount of remaining pollution declines.
Question
Question
Question
Question
The table below shows the marginal benefit and marginal cost of pollution abatement for an economy.  TABLE 17-1
Refer to Table 17-1.Suppose a public authority has the mandate to maximize social welfare by choosing the appropriate amount of pollution abatement.The marginal cost of reducing pollution by one unit is ________ at a(n) ________ rate.
A)increasing; constant
B)increasing; decreasing
C)increasing; increasing
D)decreasing; decreasing
E)decreasing; reduced
TABLE 17-1Refer to Table 17-1.Suppose a public authority has the mandate to maximize social welfare by choosing the appropriate amount of pollution abatement.The marginal cost of reducing pollution by one unit is ________ at a(n) ________ rate.
A)increasing; constant
B)increasing; decreasing
C)increasing; increasing
D)decreasing; decreasing
E)decreasing; reduced
Question
Question
The table below shows the marginal costs and marginal benefits associated with cleaning up a polluted landfill site. TABLE 17-2
Refer to Table 17-2.What is the net benefit to society of achieving the 20th percentage point of cleanliness of this land?
A)$17.75 million
B)$9.0 million
C)$18.25 million
D)$7.5 million
E)-$7.5 million
TABLE 17-2Refer to Table 17-2.What is the net benefit to society of achieving the 20th percentage point of cleanliness of this land?
A)$17.75 million
B)$9.0 million
C)$18.25 million
D)$7.5 million
E)-$7.5 million
Question
Question
The table below shows the marginal costs and marginal benefits associated with cleaning up a polluted landfill site. TABLE 17-2
Refer to Table 17-2.What is the net benefit to society of achieving the 100th percentage point of cleanliness of this land?
A)$42 million
B)$4 million
C)-$4 million
D)$0
E)-$16 million
TABLE 17-2Refer to Table 17-2.What is the net benefit to society of achieving the 100th percentage point of cleanliness of this land?
A)$42 million
B)$4 million
C)-$4 million
D)$0
E)-$16 million
Question
The table below shows the marginal benefit and marginal cost of pollution abatement for an economy. TABLE 17-1
Refer to Table 17-1.Suppose a public authority has the mandate to maximize social welfare by choosing the appropriate amount of pollution abatement.The optimal amount of pollution abatement is ________ units and implies a ________ amount of pollution remaining
A)8; 0
B)120; negative
C)5; positive
D)70; positive
E)5; negative
TABLE 17-1Refer to Table 17-1.Suppose a public authority has the mandate to maximize social welfare by choosing the appropriate amount of pollution abatement.The optimal amount of pollution abatement is ________ units and implies a ________ amount of pollution remaining
A)8; 0
B)120; negative
C)5; positive
D)70; positive
E)5; negative
Question
The figure below shows the demand and supply curves for pollution abatement.
FIGURE 17-3
Refer to Figure 17-3.On the horizontal axis,the label ʺQt(100% abatement)ʺ refers to
A)the maximum pollution abatement that is cost effective.
B)the maximum pollution abatement attainable at the lowest cost.
C)the maximum pollution abatement attainable with given technology.
D)zero remaining pollution.
E)zero pollution abatement.
FIGURE 17-3Refer to Figure 17-3.On the horizontal axis,the label ʺQt(100% abatement)ʺ refers to
A)the maximum pollution abatement that is cost effective.
B)the maximum pollution abatement attainable at the lowest cost.
C)the maximum pollution abatement attainable with given technology.
D)zero remaining pollution.
E)zero pollution abatement.
Question
The table below shows the marginal benefit and marginal cost of pollution abatement for an economy. TABLE 17-1
Refer to Table 17-1.Suppose a public authority has the mandate to maximize social welfare by choosing the appropriate amount of pollution abatement. Compared to the optimal level of abatement,pollution abatement of 7 units would ________ total social welfare by ________.
A)increase; $15
B)increase; $110
C)decrease; $110
D)decrease; $125
E)decrease; $160
TABLE 17-1Refer to Table 17-1.Suppose a public authority has the mandate to maximize social welfare by choosing the appropriate amount of pollution abatement. Compared to the optimal level of abatement,pollution abatement of 7 units would ________ total social welfare by ________.
A)increase; $15
B)increase; $110
C)decrease; $110
D)decrease; $125
E)decrease; $160
Question
The table below shows the marginal benefit and marginal cost of pollution abatement for an economy. TABLE 17-1
Refer to Table 17-1.Suppose a public authority has the mandate to maximize social welfare by choosing the appropriate amount of pollution abatement.The total net benefit from the optimal amount of pollution abatement is
A)$0.
B)$120.
C)$155.
D)$275.
E)$330.
TABLE 17-1Refer to Table 17-1.Suppose a public authority has the mandate to maximize social welfare by choosing the appropriate amount of pollution abatement.The total net benefit from the optimal amount of pollution abatement is
A)$0.
B)$120.
C)$155.
D)$275.
E)$330.
Question
Question
The diagram below shows the marginal cost of pollution abatement for two firms,Firm X and Firm Y.
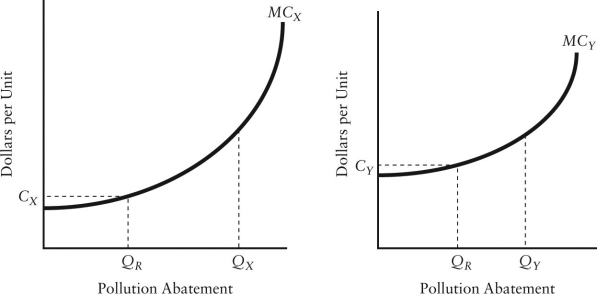 FIGURE 17-4
Refer to Figure 17-4.Suppose Firms X and Y are each abating QR units of pollution.If Firm X then reduces pollution by one unit and Firm Y increases pollution by one unit,then
A)total pollution remains the same but the total cost of abatement falls.
B)total pollution remains the same but the total cost of abatement increases.
C)the total cost of abatement remains the same but pollution falls.
D)the total cost of abatement remains the same but pollution increases.
E)the total costs of abatement and the amount of pollution do not change.
FIGURE 17-4Refer to Figure 17-4.Suppose Firms X and Y are each abating QR units of pollution.If Firm X then reduces pollution by one unit and Firm Y increases pollution by one unit,then
A)total pollution remains the same but the total cost of abatement falls.
B)total pollution remains the same but the total cost of abatement increases.
C)the total cost of abatement remains the same but pollution falls.
D)the total cost of abatement remains the same but pollution increases.
E)the total costs of abatement and the amount of pollution do not change.
Question
Question
The diagram below shows the marginal costs of pollution abatement for two firms,Firm 1 and Firm 2.
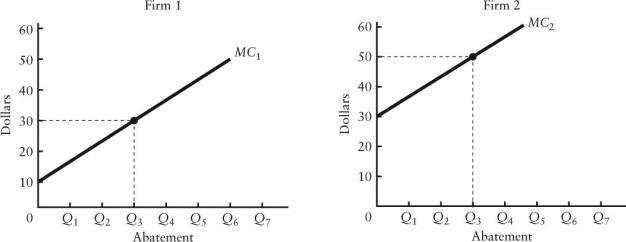 FIGURE 17-5
Refer to Figure 17-5.If the government requires each firm to abate Q3 units of pollution,the social costs of this abatement
A)would be minimized.
B)could be reduced further if each firm was required to abate more.
C)could be reduced further if Firm 1 increased its abatement and Firm 2 reduced its abatement by the same amount.
D)could be reduced further if Firm 2 increased abatement and Firm 1 reduced its abatement by the same amount.
E)could be reduced further if each firm was allowed to pollute more.
FIGURE 17-5Refer to Figure 17-5.If the government requires each firm to abate Q3 units of pollution,the social costs of this abatement
A)would be minimized.
B)could be reduced further if each firm was required to abate more.
C)could be reduced further if Firm 1 increased its abatement and Firm 2 reduced its abatement by the same amount.
D)could be reduced further if Firm 2 increased abatement and Firm 1 reduced its abatement by the same amount.
E)could be reduced further if each firm was allowed to pollute more.
Question
Question
The diagram below shows the marginal costs of pollution abatement for two firms,Firm 1 and Firm 2.
FIGURE 17-5
Refer to Figure 17-5.Suppose each firm is currently abating pollution to the level Q3.Which of the following statements is true?
A)This outcome is efficient because both firms are abating the same amount.
B)This outcome is not allocatively efficient because the marginal benefits and marginal costs of abatement are not equated.
C)This outcome is not allocatively efficient because less than 100% abatement is being achieved.
D)This outcome is not productively efficient because one firm is abating more pollution than the other.
E)This outcome is not productively efficient because the total cost of achieving this level of abatement is not minimized.
FIGURE 17-5Refer to Figure 17-5.Suppose each firm is currently abating pollution to the level Q3.Which of the following statements is true?
A)This outcome is efficient because both firms are abating the same amount.
B)This outcome is not allocatively efficient because the marginal benefits and marginal costs of abatement are not equated.
C)This outcome is not allocatively efficient because less than 100% abatement is being achieved.
D)This outcome is not productively efficient because one firm is abating more pollution than the other.
E)This outcome is not productively efficient because the total cost of achieving this level of abatement is not minimized.
Question
Question
Question
Question
Question
The diagram below shows the marginal costs of pollution abatement for two firms,Firm 1 and Firm 2.
FIGURE 17-5
Refer to Figure 17-5.Suppose the government requires that each firm abate pollution to the level Q 3.The outcome would be efficient because
A)the marginal costs of abatement are equated for the two firms.
B)the maximum amount of pollution is being abated at the lowest cost.
C)the marginal cost and marginal benefit of pollution abatement are equated.
D)all of the above.
E)none of the above; the outcome would be inefficient.
FIGURE 17-5Refer to Figure 17-5.Suppose the government requires that each firm abate pollution to the level Q 3.The outcome would be efficient because
A)the marginal costs of abatement are equated for the two firms.
B)the maximum amount of pollution is being abated at the lowest cost.
C)the marginal cost and marginal benefit of pollution abatement are equated.
D)all of the above.
E)none of the above; the outcome would be inefficient.
Question
The diagram below shows the marginal cost of pollution abatement for two firms,Firm X and Firm Y.
FIGURE 17-4
Refer to Figure 17-4.Suppose the government requires each firm to reduce pollution by the same amount,QR.The result will be
A)fair and just because both firms are facing the same requirements.
B)economically inefficient because Firm X is not producing as much pollution as Firm Y and therefore should not be faced with the same requirements.
C)economically efficient because even though their marginal costs of abatement differ,the marginal cost for the last unit of abatement is equal.
D)economically inefficient because Firm Y is then abating pollution at a higher marginal cost than Firm X.
E)economically efficient because the maximum amount of pollution will be abated.
FIGURE 17-4Refer to Figure 17-4.Suppose the government requires each firm to reduce pollution by the same amount,QR.The result will be
A)fair and just because both firms are facing the same requirements.
B)economically inefficient because Firm X is not producing as much pollution as Firm Y and therefore should not be faced with the same requirements.
C)economically efficient because even though their marginal costs of abatement differ,the marginal cost for the last unit of abatement is equal.
D)economically inefficient because Firm Y is then abating pollution at a higher marginal cost than Firm X.
E)economically efficient because the maximum amount of pollution will be abated.
Question
Question
The diagram below shows the marginal cost of pollution abatement for two firms,Firm X and Firm Y.
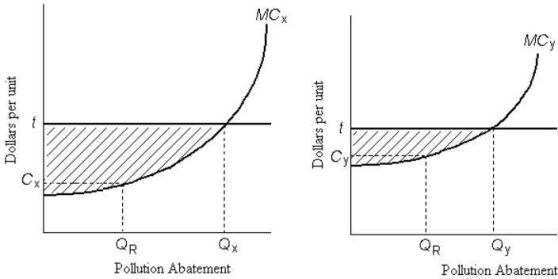 FIGURE 17-6
Refer to Figure 17-6.Firms X and Y have an emissions tax of $t imposed on each unit of pollution they produce.Firm X will choose to abate pollution of ________ units and Firm Y will choose to abate pollution of________ units.
A)QR; QR
B)QX; QR
C)QX; QY
D)0; 0
E)QR; QY
FIGURE 17-6Refer to Figure 17-6.Firms X and Y have an emissions tax of $t imposed on each unit of pollution they produce.Firm X will choose to abate pollution of ________ units and Firm Y will choose to abate pollution of________ units.
A)QR; QR
B)QX; QR
C)QX; QY
D)0; 0
E)QR; QY
Question
The diagram below shows the marginal cost of pollution abatement for two firms,Firm X and Firm Y.
FIGURE 17-4
Refer to Figure 17-4.The optimal amount of pollution abatement for these two firms together is
A)QR for X + QR for Y.
B)QR for X + Qy for Y.
C)Qx for X + QR for Y.
D)Qx + Qy.
E)impossible to tell without the marginal benefit of abatement curve.
FIGURE 17-4Refer to Figure 17-4.The optimal amount of pollution abatement for these two firms together is
A)QR for X + QR for Y.
B)QR for X + Qy for Y.
C)Qx for X + QR for Y.
D)Qx + Qy.
E)impossible to tell without the marginal benefit of abatement curve.
Question
The diagram below shows the marginal cost of pollution abatement for two firms,Firm X and Firm Y.
FIGURE 17-6
Refer to Figure 17-6.Ignore the horizontal line at t.If the government wanted to impose an emissions tax,efficiency requires that it
A)levy a tax at the same rate to both firms.
B)choose a different tax rate for each firm so that each firm abates QR units of pollution.
C)impose the same tax on both firms and also fix the amount of pollution abatement at QR for each firm.
D)tax only the high-cost firm (Firm Y)and fix the amount of pollution abatement for the low-cost firm (Firm X).
E)tax only the low-cost firm (Firm X)and fix the amount of pollution abatement for the high -cost firm (Firm Y).
FIGURE 17-6Refer to Figure 17-6.Ignore the horizontal line at t.If the government wanted to impose an emissions tax,efficiency requires that it
A)levy a tax at the same rate to both firms.
B)choose a different tax rate for each firm so that each firm abates QR units of pollution.
C)impose the same tax on both firms and also fix the amount of pollution abatement at QR for each firm.
D)tax only the high-cost firm (Firm Y)and fix the amount of pollution abatement for the low-cost firm (Firm X).
E)tax only the low-cost firm (Firm X)and fix the amount of pollution abatement for the high -cost firm (Firm Y).
Question
Question
Question
Question
Question

Unlock Deck
Sign up to unlock the cards in this deck!
Unlock Deck
Unlock Deck
1/126
Play
Full screen (f)
Deck 17: The Economics of Environmental Protection
1
A paper mill discharges chemicals into a river which pollutes the shores of a downstream resort area.The private marginal cost,social marginal cost,and marginal benefit associated with the production of paper are given by the following equations: MCP = 5 + Q MCS = 10 + 2Q MB = 35 - 0.5Q.
The allocatively efficient level of output is ________ units.
A)0
B)10
C)15
D)25
E)30
The allocatively efficient level of output is ________ units.
A)0
B)10
C)15
D)25
E)30
10
2
A paper mill discharges chemicals into a river which pollutes the shores of a downstream resort area.The private marginal cost,social marginal cost,and marginal benefit associated with the production of paper are given by the following equations: MCP = 5 + Q MCS = 10 + 2Q MB = 35 - 0.5Q.
A competitive free market will produce output of ________ units, and this amount is ________ than the allocatively efficient level of output.
A)5; less
B)10; less
C)15; more
D)20; more
E)25; more
A competitive free market will produce output of ________ units, and this amount is ________ than the allocatively efficient level of output.
A)5; less
B)10; less
C)15; more
D)20; more
E)25; more
20; more
3
The figure below shows the marginal benefit to consumers,MB,the marginal cost to private firms,MCP,and the marginal cost to society,MCS,at each level of output of some good.
FIGURE 17-1
Refer to Figure 17-1.A negative externality is depicted because the
A)marginal social cost is greater than the marginal social benefit.
B)marginal social cost is greater than the marginal private cost.
C)marginal social benefit to consumers is diminishing with greater output.
D)optimal level of output occurs where marginal private cost is positive.
E)optimal level of output occurs where marginal private benefit is positive.
FIGURE 17-1Refer to Figure 17-1.A negative externality is depicted because the
A)marginal social cost is greater than the marginal social benefit.
B)marginal social cost is greater than the marginal private cost.
C)marginal social benefit to consumers is diminishing with greater output.
D)optimal level of output occurs where marginal private cost is positive.
E)optimal level of output occurs where marginal private benefit is positive.
marginal social cost is greater than the marginal private cost.
4
The figure below shows the marginal benefit to consumers,MB,the marginal cost to private firms,MCP,and the marginal cost to society,MCS,at each level of output of some good.
FIGURE 17-1
Refer to Figure 17-1.The price that leads consumers to demand the socially optimal quantity of output is
A)zero.
B)P1.
C)P2.
D)P3.
E)not possible to know from the information given.
FIGURE 17-1Refer to Figure 17-1.The price that leads consumers to demand the socially optimal quantity of output is
A)zero.
B)P1.
C)P2.
D)P3.
E)not possible to know from the information given.
Unlock Deck
Unlock for access to all 126 flashcards in this deck.
Unlock Deck
k this deck
5
The social marginal cost of the production of snowmobiles
A)is less than the marginal external cost of production.
B)is greater than the sum of the private marginal cost and external cost.
C)includes only the cost of the labour input.
D)includes the noise pollution imposed on those living near snowmobile trails.
E)includes only the opportunity cost of all capital equipment.
Unlock Deck
Unlock for access to all 126 flashcards in this deck.
Unlock Deck
k this deck
6
Economists generally view pollution as
A)an economic ʺbadʺ that must be eliminated entirely.
B)a negative economy.
C)a negative externality.
D)a positive externality.
E)a non-excludable good.
A)an economic ʺbadʺ that must be eliminated entirely.
B)a negative economy.
C)a negative externality.
D)a positive externality.
E)a non-excludable good.
Unlock Deck
Unlock for access to all 126 flashcards in this deck.
Unlock Deck
k this deck
7
A paper mill discharges chemicals into a river which pollutes the shores of a downstream resort area.The private marginal cost,social marginal cost,and marginal benefit associated with the production of paper are given by the following equations: MCP = 5 + Q MCS = 10 + 2Q MB = 35 - 0.5Q.
The marginal external cost at the allocatively efficient level of output is
A)0.
B)5.
C)10.
D)15.
E)20.
The marginal external cost at the allocatively efficient level of output is
A)0.
B)5.
C)10.
D)15.
E)20.
Unlock Deck
Unlock for access to all 126 flashcards in this deck.
Unlock Deck
k this deck
8
If pollution is associated with the production of some good,then
A)the marginal social cost is less than the marginal social benefit.
B)the price of the good is equal to firmsʹ marginal private cost.
C)marginal social cost minus marginal private cost is negative.
D)marginal social cost minus marginal private cost is positive.
E)too little of the good is being produced by the firm.
Unlock Deck
Unlock for access to all 126 flashcards in this deck.
Unlock Deck
k this deck
9
A paper mill discharges chemicals into a river which pollutes the shores of a downstream resort area.The private marginal cost,social marginal cost,and marginal benefit associated with the production of paper are given by the following equations: MCP = 5 + Q MCS = 10 + 2Q MB = 35 - 0.5Q
The marginal social cost at the competitive free-market equilibrium is
A)5.
B)10.
C)20.
D)25.
E)50.
The marginal social cost at the competitive free-market equilibrium is
A)5.
B)10.
C)20.
D)25.
E)50.
Unlock Deck
Unlock for access to all 126 flashcards in this deck.
Unlock Deck
k this deck
10
When firms in an industry have fully internalized a production externality,
A)they produce at less than the optimal level of output.
B)they produce at more than the optimal level of output.
C)it is not possible to achieve allocative efficiency.
D)the marginal social cost is zero.
E)they bear the entire social marginal cost of production.
A)they produce at less than the optimal level of output.
B)they produce at more than the optimal level of output.
C)it is not possible to achieve allocative efficiency.
D)the marginal social cost is zero.
E)they bear the entire social marginal cost of production.
Unlock Deck
Unlock for access to all 126 flashcards in this deck.
Unlock Deck
k this deck
11
A paper mill discharges chemicals into a river which pollutes the shores of a downstream resort area.The private marginal cost,social marginal cost,and marginal benefit associated with the production of paper are given by the following equations: MCP = 5 + Q MCS = 10 + 2Q MB = 35 - 0.5Q.
The marginal external cost at the competitive free-market equilibrium is
A)5.
B)10.
C)15.
D)20
E)25.
The marginal external cost at the competitive free-market equilibrium is
A)5.
B)10.
C)15.
D)20
E)25.
Unlock Deck
Unlock for access to all 126 flashcards in this deck.
Unlock Deck
k this deck
12
When a farmer in Manitoba produces fertilizer run-off that pollutes the local water system,
A)the amount of farm output will not be profitable.
B)the amount of farm output produced will not be cost-effective.
C)the amount of farm output produced will be less than the efficient level.
D)the farm should stop producing agricultural products altogether.
E)the amount of farm output produced will exceed the efficient level.
Unlock Deck
Unlock for access to all 126 flashcards in this deck.
Unlock Deck
k this deck
13
When an external cost associated with the production of some good has been internalized,it means that
A)the opportunity cost of production is passed on to the consumer.
B)the private cost of production is borne by the producer.
C)the external costs are incorporated into private decision making.
D)the consumer is bearing the net social benefits imposed by the producer.
E)the firm is ignoring social costs.
Unlock Deck
Unlock for access to all 126 flashcards in this deck.
Unlock Deck
k this deck
14
The figure below shows the marginal benefit to consumers,MB,the marginal cost to private firms,MCP,and the marginal cost to society,MCS,at each level of output of some good.
FIGURE 17-1
Refer to Figure 17-1.What is the marginal external cost at output level Q3?
A)P1
B)P2
C)P4
D)P4 - P2
E)P3 - P1
FIGURE 17-1Refer to Figure 17-1.What is the marginal external cost at output level Q3?
A)P1
B)P2
C)P4
D)P4 - P2
E)P3 - P1
Unlock Deck
Unlock for access to all 126 flashcards in this deck.
Unlock Deck
k this deck
15
The figure below shows the marginal benefit to consumers,MB,the marginal cost to private firms,MCP,and the marginal cost to society,MCS,at each level of output of some good.
FIGURE 17-1
Refer to Figure 17-1.The price that would occur in a competitive market in the absence of government intervention is
A)P1.
B)P2.
C)P3.
D)P4.
E)not possible to know from the information given.
FIGURE 17-1Refer to Figure 17-1.The price that would occur in a competitive market in the absence of government intervention is
A)P1.
B)P2.
C)P3.
D)P4.
E)not possible to know from the information given.
Unlock Deck
Unlock for access to all 126 flashcards in this deck.
Unlock Deck
k this deck
16
A paper mill discharges chemicals into a river which pollutes the shores of a downstream resort area.The private marginal cost,social marginal cost,and marginal benefit associated with the production of paper are given by the following equations: MCP = 5 + Q MCS = 10 + 2Q MB = 35 - 0.5Q.
The marginal external cost is ________ throughout the output range.
A)zero
B)constant
C)increasing
D)decreasing
E)negative
The marginal external cost is ________ throughout the output range.
A)zero
B)constant
C)increasing
D)decreasing
E)negative
Unlock Deck
Unlock for access to all 126 flashcards in this deck.
Unlock Deck
k this deck
17
Suppose a firm producing roof shingles imposes a negative externality on the surrounding area due to the noxious fumes emitted from the plant.The private marginal cost,social marginal cost and marginal benefit associated with the production of the shingles are given by the following equations: MCP = 5 + 2Q MCS = 10 + 3Q MB = 50 - Q
The social marginal cost at the competitive equilibrium is ________ per unit.
A)$5
B)$13
C)$50
D)$55
E)$25
The social marginal cost at the competitive equilibrium is ________ per unit.
A)$5
B)$13
C)$50
D)$55
E)$25
Unlock Deck
Unlock for access to all 126 flashcards in this deck.
Unlock Deck
k this deck
18
Suppose a firm producing roof shingles imposes a negative externality on the surrounding area due to the noxious fumes emitted from the plant.The private marginal cost,social marginal cost and marginal benefit associated with the production of the shingles are given by the following equations: MCP = 5 + 2Q MCS = 10 + 3Q MB = 50 - Q
A competitive free market will produce ________ units, at a price of ________ per unit
A)20; $25
B)20; $40
C)15; $40
D)15; $35
E)10; $35
A competitive free market will produce ________ units, at a price of ________ per unit
A)20; $25
B)20; $40
C)15; $40
D)15; $35
E)10; $35
Unlock Deck
Unlock for access to all 126 flashcards in this deck.
Unlock Deck
k this deck
19
The figure below shows the marginal benefit to consumers,MB,the marginal cost to private firms,MCP,and the marginal cost to society,MCS,at each level of output of some good.
FIGURE 17-1
Refer to Figure 17-1.The equilibrium output that would occur in a competitive market in the absence of government intervention is
A)zero.
B)Q1.
C)Q2.
D)Q3.
E)none of the above; there is no equilibrium output level.
FIGURE 17-1Refer to Figure 17-1.The equilibrium output that would occur in a competitive market in the absence of government intervention is
A)zero.
B)Q1.
C)Q2.
D)Q3.
E)none of the above; there is no equilibrium output level.
Unlock Deck
Unlock for access to all 126 flashcards in this deck.
Unlock Deck
k this deck
20
The figure below shows the marginal benefit to consumers,MB,the marginal cost to private firms,MCP,and the marginal cost to society,MCS,at each level of output of some good.
FIGURE 17-1
Refer to Figure 17-1.The socially optimal level of output is
A)zero.
B)Q1.
C)Q2.
D)Q3.
E)none of the above; there is no optimal output level.
FIGURE 17-1Refer to Figure 17-1.The socially optimal level of output is
A)zero.
B)Q1.
C)Q2.
D)Q3.
E)none of the above; there is no optimal output level.
Unlock Deck
Unlock for access to all 126 flashcards in this deck.
Unlock Deck
k this deck
21
Which of the following is the best analogy for the marginal cost of pollution abatement curve?
A)a demand curve for pollution abatement
B)a supply curve for pollution abatement
C)the private marginal cost of abatement curve
D)the external cost of abatement curve
E)the net social cost of abatement curve
A)a demand curve for pollution abatement
B)a supply curve for pollution abatement
C)the private marginal cost of abatement curve
D)the external cost of abatement curve
E)the net social cost of abatement curve
Unlock Deck
Unlock for access to all 126 flashcards in this deck.
Unlock Deck
k this deck
22
The optimal amount of pollution abatement is generally less than 100%.Complete (100% )abatement would be optimal if
A)the marginal cost of abatement is positive but less than the marginal benefit of abatement.
B)the marginal cost of abatement is always zero.
C)the marginal cost of abatement exceeds the marginal benefit of abatement at all levels of abatement.
D)the marginal benefit of abatement is zero.
E)none of the above - we cannot even imagine a situation in which complete abatement would be optimal.
Unlock Deck
Unlock for access to all 126 flashcards in this deck.
Unlock Deck
k this deck
23
The diagram below shows the private and social marginal costs (MCP and MCS)and the social marginal benefits (MBS)of producing disposable diapers.
FIGURE 17-2
Refer to Figure 17-2.The allocatively efficient level of production and use of disposable diapers is
A)Q0,because that is where MCS exceeds MCP.
B)Q0,because that is where MCS equals MBS.
C)Q1,because that is where MCP equals MBS.
D)Q1,because that is where MCS equals MBS.
E)Q2,because that is where the externality is internalized.
FIGURE 17-2Refer to Figure 17-2.The allocatively efficient level of production and use of disposable diapers is
A)Q0,because that is where MCS exceeds MCP.
B)Q0,because that is where MCS equals MBS.
C)Q1,because that is where MCP equals MBS.
D)Q1,because that is where MCS equals MBS.
E)Q2,because that is where the externality is internalized.
Unlock Deck
Unlock for access to all 126 flashcards in this deck.
Unlock Deck
k this deck
24
When the marginal costs of pollution abatement equal the marginal benefits of pollution abatement,
A)any further reductions in pollution will lower net social benefits.
B)pollution has been entirely eliminated.
C)any further reductions in pollution will continue to increase net social benefits.
D)then firms are likely to increase output.
E)then firms are likely to decrease output.
A)any further reductions in pollution will lower net social benefits.
B)pollution has been entirely eliminated.
C)any further reductions in pollution will continue to increase net social benefits.
D)then firms are likely to increase output.
E)then firms are likely to decrease output.
Unlock Deck
Unlock for access to all 126 flashcards in this deck.
Unlock Deck
k this deck
25
Economic analysis of the optimal amount of pollution is typically done in terms of the amount of pollution abated,as opposed to the amount of pollution produced.Why?
A)Because it is more practical to measure the marginal costs of pollution abated than of pollution produced.
B)Because governments and environmental authorities can produce more reliable data on pollution abated than pollution produced,which facilitates the economic analysis.
C)Because the abatement of pollution is a ʺgoodʺ to which we can more easily apply the concepts of supply and demand.
D)Because there are no marginal benefits of pollution produced,so it is necessary to study pollution abated in order to equate marginal benefits and marginal costs.
E)All of the above are correct.
Unlock Deck
Unlock for access to all 126 flashcards in this deck.
Unlock Deck
k this deck
26
The optimal amount of pollution abatement is such that
A)the total benefit of reducing pollution is equal to the total cost of reducing pollution.
B)the marginal social cost of reducing pollution is just equal to the marginal social benefits from doing so.
C)the marginal private cost of reducing pollution is just equal to the profit of the polluting firms.
D)there is no remaining pollution.
E)none of the above; there is no optimal amount of pollution abatement.
Unlock Deck
Unlock for access to all 126 flashcards in this deck.
Unlock Deck
k this deck
27
The socially optimal level of output of any good is the quantity where all marginal costs of production,private plus external,equal the
A)marginal cost of production.
B)marginal benefit to society.
C)average benefit to society.
D)total benefit to society.
E)marginal benefit to the firm.
A)marginal cost of production.
B)marginal benefit to society.
C)average benefit to society.
D)total benefit to society.
E)marginal benefit to the firm.
Unlock Deck
Unlock for access to all 126 flashcards in this deck.
Unlock Deck
k this deck
28
When considering an entire industry,the marginal benefit of reducing pollution is expected
A)to rise as the level of pollution gets closer to zero.
B)to remain constant for all levels of pollution control.
C)to exceed the marginal cost of pollution abatement for all positive levels of pollution.
D)to fall as the amount of pollution abatement rises.
E)to be always greater than the marginal cost of pollution reduction.
Unlock Deck
Unlock for access to all 126 flashcards in this deck.
Unlock Deck
k this deck
29
Suppose a firm producing roof shingles imposes a negative externality on the surrounding area due to the noxious fumes emitted from the plant.The private marginal cost,social marginal cost and marginal benefit associated with the production of the shingles are given by the following equations: MCP = 5 + 2Q MCS = 10 + 3Q MB = 50 - Q
The marginal external cost at the competitive equilibrium is ________ per unit.
A)$5
B)$10
C)$15
D)$20
E)$25
The marginal external cost at the competitive equilibrium is ________ per unit.
A)$5
B)$10
C)$15
D)$20
E)$25
Unlock Deck
Unlock for access to all 126 flashcards in this deck.
Unlock Deck
k this deck
30
A downward-sloping marginal benefit curve for pollution abatement means that
A)the costs of pollution decrease as further amounts are abated.
B)the marginal cost of pollution reduction will always exceed the marginal benefit.
C)it is impossible to know the benefits from additional increments of pollution abatement.
D)society views additional increments of pollution abatement as unnecessary.
E)there are decreasing incremental benefits to be realized from additional increments of pollution abatement.
Unlock Deck
Unlock for access to all 126 flashcards in this deck.
Unlock Deck
k this deck
31
What is the ʺmarginal cost of pollution abatementʺ?
A)the private cost of producing one additional unit of pollution
B)the social cost of producing one additional unit of pollution
C)the cost of the last unit of pollution produced
D)the cost of reducing pollution by one additional unit
E)the external cost of pollution abatement
A)the private cost of producing one additional unit of pollution
B)the social cost of producing one additional unit of pollution
C)the cost of the last unit of pollution produced
D)the cost of reducing pollution by one additional unit
E)the external cost of pollution abatement
Unlock Deck
Unlock for access to all 126 flashcards in this deck.
Unlock Deck
k this deck
32
Consider an oil company extracting oil from the Oil Sands in Northern Alberta.The production process generates greenhouse-gas emissions.At the socially optimal level of oil extraction,
A)the level of emissions will be zero.
B)the marginal cost of the emissions will be equal to the social marginal benefit derived from the extracted oil.
C)the marginal cost of the emissions will be more than the social marginal benefit derived from the extracted oil.
D)the social marginal cost of the oil extraction will be equal to its social marginal benefit.
E)the social marginal cost of the oil extraction will exceed its social marginal benefit.
Unlock Deck
Unlock for access to all 126 flashcards in this deck.
Unlock Deck
k this deck
33
Zero environmental damage is probably
A)technologically possible and economically efficient.
B)technologically possible but not economically efficient.
C)economically efficient but not technologically possible.
D)neither technologically possible nor economically efficient.
E)necessary if the human race is to survive.
A)technologically possible and economically efficient.
B)technologically possible but not economically efficient.
C)economically efficient but not technologically possible.
D)neither technologically possible nor economically efficient.
E)necessary if the human race is to survive.
Unlock Deck
Unlock for access to all 126 flashcards in this deck.
Unlock Deck
k this deck
34
Zero pollution is almost surely NOT a desirable social goal because
A)the marginal benefit is equal to zero.
B)the marginal cost is equal to zero.
C)the totals costs of complete pollution elimination will be far greater than the total benefits.
D)the total benefits of complete pollution elimination will be far greater than the total costs.
E)society benefits by employing people in the ʺpollution fightingʺ industry.
Unlock Deck
Unlock for access to all 126 flashcards in this deck.
Unlock Deck
k this deck
35
The marginal benefit of reducing pollution in some industry may be expected to
A)rise as the level of pollution gets closer to zero.
B)remain constant for all levels of pollution control.
C)exceed the marginal cost of pollution reduction for all positive levels of pollution.
D)fall as the amount of pollution abatement undertaken rises.
E)be always greater than the marginal cost of pollution reduction.
Unlock Deck
Unlock for access to all 126 flashcards in this deck.
Unlock Deck
k this deck
36
The diagram below shows the private and social marginal costs (MCP and MCS)and the social marginal benefits (MBS)of producing disposable diapers.
FIGURE 17-2
Refer to Figure 17-2.The net social benefit derived from the production and use of disposable diapers is
A)at a minimum at Q0,because MCS exceeds MCP.
B)at a maximum at Q0,because that is where MCS equals MBS.
C)at a maximum at Q1,because that is where MCS equals MBS.
D)zero at Q0,because that is where MCS equals MBS.
E)zero at Q2,because that is where the externality is internalized.
FIGURE 17-2Refer to Figure 17-2.The net social benefit derived from the production and use of disposable diapers is
A)at a minimum at Q0,because MCS exceeds MCP.
B)at a maximum at Q0,because that is where MCS equals MBS.
C)at a maximum at Q1,because that is where MCS equals MBS.
D)zero at Q0,because that is where MCS equals MBS.
E)zero at Q2,because that is where the externality is internalized.
Unlock Deck
Unlock for access to all 126 flashcards in this deck.
Unlock Deck
k this deck
37
Suppose a firm producing roof shingles imposes a negative externality on the surrounding area due to the noxious fumes emitted from the plant.The private marginal cost,social marginal cost and marginal benefit associated with the production of the shingles are given by the following equations: MCP = 5 + 2Q MCS = 10 + 3Q MB = 50 - Q
The allocatively efficient level of output is ________ units.
A)0
B)5
C)10
D)15
E)20
The allocatively efficient level of output is ________ units.
A)0
B)5
C)10
D)15
E)20
Unlock Deck
Unlock for access to all 126 flashcards in this deck.
Unlock Deck
k this deck
38
If the government wants to ensure that producers fully internalize the marginal external cost associated with the pollution they emit,then it is necessary to
A)accurately measure that external cost.
B)first ensure that firms are operating at their profit-maximizing level of output.
C)determine the long-run average cost structure for the firms.
D)determine the short-run average cost structure for the firms.
E)eliminate all the pollution the firm emits.
A)accurately measure that external cost.
B)first ensure that firms are operating at their profit-maximizing level of output.
C)determine the long-run average cost structure for the firms.
D)determine the short-run average cost structure for the firms.
E)eliminate all the pollution the firm emits.
Unlock Deck
Unlock for access to all 126 flashcards in this deck.
Unlock Deck
k this deck
39
An upward-sloping marginal cost curve for pollution abatement means that
A)it is impossible to know the benefits from additional increments of pollution reduction.
B)additional increments of pollution abatement will yield decreasing benefits.
C)society views additional increments of pollution reduction as absolutely necessary.
D)the cost of an extra unit of pollution abatement will increase as the total amount of abatement rises.
E)the marginal benefit of pollution reduction will increase with additional increments of pollution reduction.
Unlock Deck
Unlock for access to all 126 flashcards in this deck.
Unlock Deck
k this deck
40
The diagram below shows the private and social marginal costs (MCP and MCS)and the social marginal benefits (MBS)of producing disposable diapers.
FIGURE 17-2
Refer to Figure 17-2.The net social benefit derived from the production and use of the last unit of disposable diapers is
A)at a minimum at Q0,because MCS exceeds MCP.
B)at a maximum at Q0,because that is where MCS equals MBS.
C)at a maximum at Q1,because that is where MCS equals MBS.
D)zero at Q0,because that is where MCS equals MBS.
E)zero at Q2,because that is where the externality is fully maximized.
FIGURE 17-2Refer to Figure 17-2.The net social benefit derived from the production and use of the last unit of disposable diapers is
A)at a minimum at Q0,because MCS exceeds MCP.
B)at a maximum at Q0,because that is where MCS equals MBS.
C)at a maximum at Q1,because that is where MCS equals MBS.
D)zero at Q0,because that is where MCS equals MBS.
E)zero at Q2,because that is where the externality is fully maximized.
Unlock Deck
Unlock for access to all 126 flashcards in this deck.
Unlock Deck
k this deck
41
The table below shows the marginal costs and marginal benefits associated with cleaning up a polluted landfill site. TABLE 17-2
Refer to Table 17-2.What is the maximum total net benefit to society that can be attained by cleaning this landfill site?
A)$41.25 million
B)$25.25 million
C)$4.5 million
D)$0
E)It is not possible to determine without knowing the precise MB and MC curves.
TABLE 17-2Refer to Table 17-2.What is the maximum total net benefit to society that can be attained by cleaning this landfill site?
A)$41.25 million
B)$25.25 million
C)$4.5 million
D)$0
E)It is not possible to determine without knowing the precise MB and MC curves.
Unlock Deck
Unlock for access to all 126 flashcards in this deck.
Unlock Deck
k this deck
42
The figure below shows the demand and supply curves for pollution abatement.
FIGURE 17-3
Refer to Figure 17-3.What area on the diagram represents the net total benefit of abating pollution by the optimal amount?
A)the area under the MB curve,and above the MC curve,to the left of Q*
B)the area above the MB curve,and below the MC curve,to the right of Q*
C)the area that is below both the MB and MC curves
D)the area that is above both the MB and MC curves
E)the total area below the MB curve,to the left of Q*
FIGURE 17-3Refer to Figure 17-3.What area on the diagram represents the net total benefit of abating pollution by the optimal amount?
A)the area under the MB curve,and above the MC curve,to the left of Q*
B)the area above the MB curve,and below the MC curve,to the right of Q*
C)the area that is below both the MB and MC curves
D)the area that is above both the MB and MC curves
E)the total area below the MB curve,to the left of Q*
Unlock Deck
Unlock for access to all 126 flashcards in this deck.
Unlock Deck
k this deck
43
The table below shows the marginal costs and marginal benefits associated with cleaning up a polluted landfill site. TABLE 17-2
Refer to Table 17-2.Would it be socially optimal to achieve 100% cleanliness of this landfill site?
A)Yes,because 100% cleanliness of the land is the only socially optimal outcome.
B)No,because the technology for 100% cleanliness is not available.
C)No,because the net benefit to society at that level is not maximized.
D)Yes,because the net benefit to society at that level is positive.
E)Yes,because there is a $4.0 million marginal benefit of achieving 100% cleanliness.
TABLE 17-2Refer to Table 17-2.Would it be socially optimal to achieve 100% cleanliness of this landfill site?
A)Yes,because 100% cleanliness of the land is the only socially optimal outcome.
B)No,because the technology for 100% cleanliness is not available.
C)No,because the net benefit to society at that level is not maximized.
D)Yes,because the net benefit to society at that level is positive.
E)Yes,because there is a $4.0 million marginal benefit of achieving 100% cleanliness.
Unlock Deck
Unlock for access to all 126 flashcards in this deck.
Unlock Deck
k this deck
44
The figure below shows the demand and supply curves for pollution abatement.
FIGURE 17-3
Refer to Figure 17-3.The socially optimal amount of pollution is
A)Q* + Qt.
B)Qt - Q*.
C)Q*.
D)Qt.
E)0.
FIGURE 17-3Refer to Figure 17-3.The socially optimal amount of pollution is
A)Q* + Qt.
B)Qt - Q*.
C)Q*.
D)Qt.
E)0.
Unlock Deck
Unlock for access to all 126 flashcards in this deck.
Unlock Deck
k this deck
45
Suppose a farm that is polluting an underground water supply faces the following marginal costs for abating units of pollution: 1st unit abated,MC = $250 2nd unit abated,MC = $400 3rd unit abated,MC = $650 4th unit abated,MC = $950
The marginal benefit to society from this farm abating units of pollution are as follows: 1st unit abated,MB = $1000
2nd unit abated,MB = $800 3rd unit abated,MB = $650 4th unit abated,MB = $300
If this farm abates 4 units of pollution,what is the net benefit to society of the final unit of pollution abated?
A)$0
B)-$650
C)$1150
D)$650
E)-$1150
Unlock Deck
Unlock for access to all 126 flashcards in this deck.
Unlock Deck
k this deck
46
The figure below shows the demand and supply curves for pollution abatement.
FIGURE 17-3
Refer to Figure 17-3.The MB curve in this diagram is downward sloping because
A)the marginal benefit from a given amount of abatement will be lower,the lower the level of pollution.
B)the marginal cost of additional units of pollution abatement is decreasing.
C)the marginal damage generated by additional units of pollution is decreasing.
D)the marginal benefit from a given amount of abatement will be higher,the higher the level of pollution abated.
E)the marginal cost of additional units of pollution abatement increases as pollution abatement increases.
FIGURE 17-3Refer to Figure 17-3.The MB curve in this diagram is downward sloping because
A)the marginal benefit from a given amount of abatement will be lower,the lower the level of pollution.
B)the marginal cost of additional units of pollution abatement is decreasing.
C)the marginal damage generated by additional units of pollution is decreasing.
D)the marginal benefit from a given amount of abatement will be higher,the higher the level of pollution abated.
E)the marginal cost of additional units of pollution abatement increases as pollution abatement increases.
Unlock Deck
Unlock for access to all 126 flashcards in this deck.
Unlock Deck
k this deck
47
The figure below shows the demand and supply curves for pollution abatement.
FIGURE 17-3
Refer to Figure 17-3.The MC curve in this diagram is upward sloping because
A)the marginal benefit from a given amount of abatement will be lower,the lower the level of pollution.
B)the marginal cost of additional units of pollution abatement is decreasing.
C)the marginal damage generated by additional units of pollution is decreasing.
D)the marginal benefit from a given amount of abatement will be higher,the higher the level of pollution abated.
E)the marginal cost of additional units of pollution abatement increases as the total amount of remaining pollution declines.
FIGURE 17-3Refer to Figure 17-3.The MC curve in this diagram is upward sloping because
A)the marginal benefit from a given amount of abatement will be lower,the lower the level of pollution.
B)the marginal cost of additional units of pollution abatement is decreasing.
C)the marginal damage generated by additional units of pollution is decreasing.
D)the marginal benefit from a given amount of abatement will be higher,the higher the level of pollution abated.
E)the marginal cost of additional units of pollution abatement increases as the total amount of remaining pollution declines.
Unlock Deck
Unlock for access to all 126 flashcards in this deck.
Unlock Deck
k this deck
48
The marginal benefit of reducing pollution and the marginal cost of reducing pollution are given by the following equations: MB = -2U2 + 18,and MC = 2U2 + 2,where U is the number of units of pollution abatement.What is the optimal number of units of pollution abatement?
A)0
B)1
C)2
D)3
E)4
A)0
B)1
C)2
D)3
E)4
Unlock Deck
Unlock for access to all 126 flashcards in this deck.
Unlock Deck
k this deck
49
Suppose a farm that is polluting an underground water supply faces the following marginal costs for abating units of pollution: 1st unit abated,MC = $250 2nd unit abated,MC = $400 3rd unit abated,MC = $650 4th unit abated,MC = $950
The marginal benefit to society from this farm abating units of pollution are as follows: 1st unit abated,MB = $1000
2nd unit abated,MB = $800 3rd unit abated,MB = $650 4th unit abated,MB = $300
Why would it not be optimal for this farmer to abate four units of pollution?
A)because abating the 4th unit adds more to social costs than to social benefits
B)because the total net benefit of abating the 4th unit is greater than the total cost
C)because the total cost of abating 4 units is greater than the total benefits
D)because it is not productively efficient
E)because the farmer has no way to charge a price for the units of pollution abated
Unlock Deck
Unlock for access to all 126 flashcards in this deck.
Unlock Deck
k this deck
50
Suppose a farm that is polluting an underground water supply faces the following marginal costs for abating units of pollution: 1st unit abated,MC = $250 2nd unit abated,MC = $400 3rd unit abated,MC = $650 4th unit abated,MC = $950
The marginal benefit to society from this farm abating units of pollution are as follows: 1st unit abated,MB = $1000
2nd unit abated,MB = $800 3rd unit abated,MB = $650 4th unit abated,MB = $300
What is the socially optimal amount of pollution abatement for this farm?
A)0 units
B)1 units
C)2 units
D)3 units
E)4 units
Unlock Deck
Unlock for access to all 126 flashcards in this deck.
Unlock Deck
k this deck
51
The table below shows the marginal benefit and marginal cost of pollution abatement for an economy. TABLE 17-1
Refer to Table 17-1.Suppose a public authority has the mandate to maximize social welfare by choosing the appropriate amount of pollution abatement.The marginal cost of reducing pollution by one unit is ________ at a(n) ________ rate.
A)increasing; constant
B)increasing; decreasing
C)increasing; increasing
D)decreasing; decreasing
E)decreasing; reduced
TABLE 17-1Refer to Table 17-1.Suppose a public authority has the mandate to maximize social welfare by choosing the appropriate amount of pollution abatement.The marginal cost of reducing pollution by one unit is ________ at a(n) ________ rate.
A)increasing; constant
B)increasing; decreasing
C)increasing; increasing
D)decreasing; decreasing
E)decreasing; reduced
Unlock Deck
Unlock for access to all 126 flashcards in this deck.
Unlock Deck
k this deck
52
The marginal benefit of reducing pollution and the marginal cost of reducing pollution are given by the following equations: MB = -2U2 + 18,and MC = 2U2 + 2,where U is the number of units of pollution abatement.What is the net marginal benefit (MB - MC)of abating the first unit of pollution (U = 1)?
A)10
B)12
C)14
D)16
E)18
A)10
B)12
C)14
D)16
E)18
Unlock Deck
Unlock for access to all 126 flashcards in this deck.
Unlock Deck
k this deck
53
The table below shows the marginal costs and marginal benefits associated with cleaning up a polluted landfill site. TABLE 17-2
Refer to Table 17-2.What is the net benefit to society of achieving the 20th percentage point of cleanliness of this land?
A)$17.75 million
B)$9.0 million
C)$18.25 million
D)$7.5 million
E)-$7.5 million
TABLE 17-2Refer to Table 17-2.What is the net benefit to society of achieving the 20th percentage point of cleanliness of this land?
A)$17.75 million
B)$9.0 million
C)$18.25 million
D)$7.5 million
E)-$7.5 million
Unlock Deck
Unlock for access to all 126 flashcards in this deck.
Unlock Deck
k this deck
54
Suppose a farm that is polluting an underground water supply faces the following marginal costs for abating units of pollution: 1st unit abated,MC = $250 2nd unit abated,MC = $400 3rd unit abated,MC = $650 4th unit abated,MC = $950
The marginal benefit to society from this farm abating units of pollution are as follows: 1st unit abated,MB = $1000
2nd unit abated,MB = $800 3rd unit abated,MB = $650 4th unit abated,MB = $300
What is the total net benefit to society if this farm engages in the socially optimal amount of pollution abatement?
A)$0
B)$650
C)$1150
D)$1300
E)$2250
Unlock Deck
Unlock for access to all 126 flashcards in this deck.
Unlock Deck
k this deck
55
The table below shows the marginal costs and marginal benefits associated with cleaning up a polluted landfill site. TABLE 17-2
Refer to Table 17-2.What is the net benefit to society of achieving the 100th percentage point of cleanliness of this land?
A)$42 million
B)$4 million
C)-$4 million
D)$0
E)-$16 million
TABLE 17-2Refer to Table 17-2.What is the net benefit to society of achieving the 100th percentage point of cleanliness of this land?
A)$42 million
B)$4 million
C)-$4 million
D)$0
E)-$16 million
Unlock Deck
Unlock for access to all 126 flashcards in this deck.
Unlock Deck
k this deck
56
The table below shows the marginal benefit and marginal cost of pollution abatement for an economy. TABLE 17-1
Refer to Table 17-1.Suppose a public authority has the mandate to maximize social welfare by choosing the appropriate amount of pollution abatement.The optimal amount of pollution abatement is ________ units and implies a ________ amount of pollution remaining
A)8; 0
B)120; negative
C)5; positive
D)70; positive
E)5; negative
TABLE 17-1Refer to Table 17-1.Suppose a public authority has the mandate to maximize social welfare by choosing the appropriate amount of pollution abatement.The optimal amount of pollution abatement is ________ units and implies a ________ amount of pollution remaining
A)8; 0
B)120; negative
C)5; positive
D)70; positive
E)5; negative
Unlock Deck
Unlock for access to all 126 flashcards in this deck.
Unlock Deck
k this deck
57
The figure below shows the demand and supply curves for pollution abatement.
FIGURE 17-3
Refer to Figure 17-3.On the horizontal axis,the label ʺQt(100% abatement)ʺ refers to
A)the maximum pollution abatement that is cost effective.
B)the maximum pollution abatement attainable at the lowest cost.
C)the maximum pollution abatement attainable with given technology.
D)zero remaining pollution.
E)zero pollution abatement.
FIGURE 17-3Refer to Figure 17-3.On the horizontal axis,the label ʺQt(100% abatement)ʺ refers to
A)the maximum pollution abatement that is cost effective.
B)the maximum pollution abatement attainable at the lowest cost.
C)the maximum pollution abatement attainable with given technology.
D)zero remaining pollution.
E)zero pollution abatement.
Unlock Deck
Unlock for access to all 126 flashcards in this deck.
Unlock Deck
k this deck
58
The table below shows the marginal benefit and marginal cost of pollution abatement for an economy. TABLE 17-1
Refer to Table 17-1.Suppose a public authority has the mandate to maximize social welfare by choosing the appropriate amount of pollution abatement. Compared to the optimal level of abatement,pollution abatement of 7 units would ________ total social welfare by ________.
A)increase; $15
B)increase; $110
C)decrease; $110
D)decrease; $125
E)decrease; $160
TABLE 17-1Refer to Table 17-1.Suppose a public authority has the mandate to maximize social welfare by choosing the appropriate amount of pollution abatement. Compared to the optimal level of abatement,pollution abatement of 7 units would ________ total social welfare by ________.
A)increase; $15
B)increase; $110
C)decrease; $110
D)decrease; $125
E)decrease; $160
Unlock Deck
Unlock for access to all 126 flashcards in this deck.
Unlock Deck
k this deck
59
The table below shows the marginal benefit and marginal cost of pollution abatement for an economy. TABLE 17-1
Refer to Table 17-1.Suppose a public authority has the mandate to maximize social welfare by choosing the appropriate amount of pollution abatement.The total net benefit from the optimal amount of pollution abatement is
A)$0.
B)$120.
C)$155.
D)$275.
E)$330.
TABLE 17-1Refer to Table 17-1.Suppose a public authority has the mandate to maximize social welfare by choosing the appropriate amount of pollution abatement.The total net benefit from the optimal amount of pollution abatement is
A)$0.
B)$120.
C)$155.
D)$275.
E)$330.
Unlock Deck
Unlock for access to all 126 flashcards in this deck.
Unlock Deck
k this deck
60
The marginal benefit of reducing pollution and the marginal cost of reducing pollution are given by the following equations: MB = -2U2 + 18,and MC = 2U2 + 2,where U is the number of units of pollution abatement.What is the number of units of pollution abatement after which there is no further social benefit from reducing pollution?
A)0
B)1
C)2
D)3
E)4
A)0
B)1
C)2
D)3
E)4
Unlock Deck
Unlock for access to all 126 flashcards in this deck.
Unlock Deck
k this deck
61
The diagram below shows the marginal cost of pollution abatement for two firms,Firm X and Firm Y.
FIGURE 17-4
Refer to Figure 17-4.Suppose Firms X and Y are each abating QR units of pollution.If Firm X then reduces pollution by one unit and Firm Y increases pollution by one unit,then
A)total pollution remains the same but the total cost of abatement falls.
B)total pollution remains the same but the total cost of abatement increases.
C)the total cost of abatement remains the same but pollution falls.
D)the total cost of abatement remains the same but pollution increases.
E)the total costs of abatement and the amount of pollution do not change.
FIGURE 17-4Refer to Figure 17-4.Suppose Firms X and Y are each abating QR units of pollution.If Firm X then reduces pollution by one unit and Firm Y increases pollution by one unit,then
A)total pollution remains the same but the total cost of abatement falls.
B)total pollution remains the same but the total cost of abatement increases.
C)the total cost of abatement remains the same but pollution falls.
D)the total cost of abatement remains the same but pollution increases.
E)the total costs of abatement and the amount of pollution do not change.
Unlock Deck
Unlock for access to all 126 flashcards in this deck.
Unlock Deck
k this deck
62
All of the following are examples of direct pollution controls EXCEPT
A)auto emissions standards.
B)legislation requiring scrubbers on coal-fired power stations.
C)legislation imposing per-unit taxes on harmful emissions from a pulp and paper plant.
D)a ban on wood stoves in some communities.
E)a monetary fine in some communities for littering.
A)auto emissions standards.
B)legislation requiring scrubbers on coal-fired power stations.
C)legislation imposing per-unit taxes on harmful emissions from a pulp and paper plant.
D)a ban on wood stoves in some communities.
E)a monetary fine in some communities for littering.
Unlock Deck
Unlock for access to all 126 flashcards in this deck.
Unlock Deck
k this deck
63
The diagram below shows the marginal costs of pollution abatement for two firms,Firm 1 and Firm 2.
FIGURE 17-5
Refer to Figure 17-5.If the government requires each firm to abate Q3 units of pollution,the social costs of this abatement
A)would be minimized.
B)could be reduced further if each firm was required to abate more.
C)could be reduced further if Firm 1 increased its abatement and Firm 2 reduced its abatement by the same amount.
D)could be reduced further if Firm 2 increased abatement and Firm 1 reduced its abatement by the same amount.
E)could be reduced further if each firm was allowed to pollute more.
FIGURE 17-5Refer to Figure 17-5.If the government requires each firm to abate Q3 units of pollution,the social costs of this abatement
A)would be minimized.
B)could be reduced further if each firm was required to abate more.
C)could be reduced further if Firm 1 increased its abatement and Firm 2 reduced its abatement by the same amount.
D)could be reduced further if Firm 2 increased abatement and Firm 1 reduced its abatement by the same amount.
E)could be reduced further if each firm was allowed to pollute more.
Unlock Deck
Unlock for access to all 126 flashcards in this deck.
Unlock Deck
k this deck
64
Direct controls for reducing pollution can be criticized from an economic viewpoint as
A)being ultimately unsuccessful in reducing pollution.
B)not being efficient in allocating the costs of pollution reduction among various firms and plants.
C)being inequitable in their application.
D)being easy to circumvent.
E)still allowing firms to pollute when a policy of ʺzero toleranceʺ is more appropriate.
Unlock Deck
Unlock for access to all 126 flashcards in this deck.
Unlock Deck
k this deck
65
The diagram below shows the marginal costs of pollution abatement for two firms,Firm 1 and Firm 2.
FIGURE 17-5
Refer to Figure 17-5.Suppose each firm is currently abating pollution to the level Q3.Which of the following statements is true?
A)This outcome is efficient because both firms are abating the same amount.
B)This outcome is not allocatively efficient because the marginal benefits and marginal costs of abatement are not equated.
C)This outcome is not allocatively efficient because less than 100% abatement is being achieved.
D)This outcome is not productively efficient because one firm is abating more pollution than the other.
E)This outcome is not productively efficient because the total cost of achieving this level of abatement is not minimized.
FIGURE 17-5Refer to Figure 17-5.Suppose each firm is currently abating pollution to the level Q3.Which of the following statements is true?
A)This outcome is efficient because both firms are abating the same amount.
B)This outcome is not allocatively efficient because the marginal benefits and marginal costs of abatement are not equated.
C)This outcome is not allocatively efficient because less than 100% abatement is being achieved.
D)This outcome is not productively efficient because one firm is abating more pollution than the other.
E)This outcome is not productively efficient because the total cost of achieving this level of abatement is not minimized.
Unlock Deck
Unlock for access to all 126 flashcards in this deck.
Unlock Deck
k this deck
66
Two firms,A and B,are legally required to reduce their toxic emissions.If Firm Aʹs marginal cost of abatement is $5 and Firm Bʹs marginal cost of abatement is $3,
A)their joint total cost of abatement is at a minimum.
B)their joint total cost of abatement is at a maximum.
C)the socially optimal joint level of abatement is not being achieved.
D)Firm A should abate more and Firm B should abate less in order to reduce total abatement costs.
E)Firm B should abate more and Firm A should abate less in order to reduce total abatement costs.
Unlock Deck
Unlock for access to all 126 flashcards in this deck.
Unlock Deck
k this deck
67
Automobile emissions standards are an example of
A)direct pollution controls.
B)emissions taxes.
C)tradable emissions standards.
D)market power.
E)a market-based environmental policy.
A)direct pollution controls.
B)emissions taxes.
C)tradable emissions standards.
D)market power.
E)a market-based environmental policy.
Unlock Deck
Unlock for access to all 126 flashcards in this deck.
Unlock Deck
k this deck
68
Consider two firms,A and B,that must engage in pollution abatement.If Firm A has a lower marginal cost of pollution abatement than Firm B,then
A)regardless of costs,it is equitable for both firms to face the same direct controls on their pollution.
B)reallocating all abatement activity to Firm A will reduce pollution and reduce the total cost of abatement.
C)reallocating some of Firm Aʹs abatement activity to Firm B will keep total abatement constant but will reduce the total cost of abatement.
D)reallocating some of Firm Bʹs abatement activity to Firm A can keep total abatement constant but reduce the total cost of abatement.
E)Firm B should lower its costs.
Unlock Deck
Unlock for access to all 126 flashcards in this deck.
Unlock Deck
k this deck
69
Federal regulation aimed at reducing greenhouse-gas emissions by setting some maximum level of emissions from each firm
A)is the best approach because the costs of reducing emissions are different for each firm.
B)is the best approach because firms will quickly reduce air pollution.
C)will usually not produce the desired reduction in emissions at the lowest possible cost.
D)will achieve the largest but not the most efficient reduction in emissions.
E)will achieve the least reduction in emissions but be the most efficient.
Unlock Deck
Unlock for access to all 126 flashcards in this deck.
Unlock Deck
k this deck
70
The diagram below shows the marginal costs of pollution abatement for two firms,Firm 1 and Firm 2.
FIGURE 17-5
Refer to Figure 17-5.Suppose the government requires that each firm abate pollution to the level Q 3.The outcome would be efficient because
A)the marginal costs of abatement are equated for the two firms.
B)the maximum amount of pollution is being abated at the lowest cost.
C)the marginal cost and marginal benefit of pollution abatement are equated.
D)all of the above.
E)none of the above; the outcome would be inefficient.
FIGURE 17-5Refer to Figure 17-5.Suppose the government requires that each firm abate pollution to the level Q 3.The outcome would be efficient because
A)the marginal costs of abatement are equated for the two firms.
B)the maximum amount of pollution is being abated at the lowest cost.
C)the marginal cost and marginal benefit of pollution abatement are equated.
D)all of the above.
E)none of the above; the outcome would be inefficient.
Unlock Deck
Unlock for access to all 126 flashcards in this deck.
Unlock Deck
k this deck
71
The diagram below shows the marginal cost of pollution abatement for two firms,Firm X and Firm Y.
FIGURE 17-4
Refer to Figure 17-4.Suppose the government requires each firm to reduce pollution by the same amount,QR.The result will be
A)fair and just because both firms are facing the same requirements.
B)economically inefficient because Firm X is not producing as much pollution as Firm Y and therefore should not be faced with the same requirements.
C)economically efficient because even though their marginal costs of abatement differ,the marginal cost for the last unit of abatement is equal.
D)economically inefficient because Firm Y is then abating pollution at a higher marginal cost than Firm X.
E)economically efficient because the maximum amount of pollution will be abated.
FIGURE 17-4Refer to Figure 17-4.Suppose the government requires each firm to reduce pollution by the same amount,QR.The result will be
A)fair and just because both firms are facing the same requirements.
B)economically inefficient because Firm X is not producing as much pollution as Firm Y and therefore should not be faced with the same requirements.
C)economically efficient because even though their marginal costs of abatement differ,the marginal cost for the last unit of abatement is equal.
D)economically inefficient because Firm Y is then abating pollution at a higher marginal cost than Firm X.
E)economically efficient because the maximum amount of pollution will be abated.
Unlock Deck
Unlock for access to all 126 flashcards in this deck.
Unlock Deck
k this deck
72
Two firms,A and B,are legally required to reduce their toxic emissions.If Firm Aʹs marginal cost of abatement is $5 and Firm Bʹs marginal cost of abatement is $5,
A)their joint total cost of abatement is at a minimum.
B)their joint total cost of abatement is at a maximum.
C)the socially optimal joint level of abatement is not being achieved.
D)Firm A should abate more and Firm B should abate less.
E)Firm B should abate more and Firm A should abate less.
A)their joint total cost of abatement is at a minimum.
B)their joint total cost of abatement is at a maximum.
C)the socially optimal joint level of abatement is not being achieved.
D)Firm A should abate more and Firm B should abate less.
E)Firm B should abate more and Firm A should abate less.
Unlock Deck
Unlock for access to all 126 flashcards in this deck.
Unlock Deck
k this deck
73
The diagram below shows the marginal cost of pollution abatement for two firms,Firm X and Firm Y.
FIGURE 17-6
Refer to Figure 17-6.Firms X and Y have an emissions tax of $t imposed on each unit of pollution they produce.Firm X will choose to abate pollution of ________ units and Firm Y will choose to abate pollution of________ units.
A)QR; QR
B)QX; QR
C)QX; QY
D)0; 0
E)QR; QY
FIGURE 17-6Refer to Figure 17-6.Firms X and Y have an emissions tax of $t imposed on each unit of pollution they produce.Firm X will choose to abate pollution of ________ units and Firm Y will choose to abate pollution of________ units.
A)QR; QR
B)QX; QR
C)QX; QY
D)0; 0
E)QR; QY
Unlock Deck
Unlock for access to all 126 flashcards in this deck.
Unlock Deck
k this deck
74
The diagram below shows the marginal cost of pollution abatement for two firms,Firm X and Firm Y.
FIGURE 17-4
Refer to Figure 17-4.The optimal amount of pollution abatement for these two firms together is
A)QR for X + QR for Y.
B)QR for X + Qy for Y.
C)Qx for X + QR for Y.
D)Qx + Qy.
E)impossible to tell without the marginal benefit of abatement curve.
FIGURE 17-4Refer to Figure 17-4.The optimal amount of pollution abatement for these two firms together is
A)QR for X + QR for Y.
B)QR for X + Qy for Y.
C)Qx for X + QR for Y.
D)Qx + Qy.
E)impossible to tell without the marginal benefit of abatement curve.
Unlock Deck
Unlock for access to all 126 flashcards in this deck.
Unlock Deck
k this deck
75
The diagram below shows the marginal cost of pollution abatement for two firms,Firm X and Firm Y.
FIGURE 17-6
Refer to Figure 17-6.Ignore the horizontal line at t.If the government wanted to impose an emissions tax,efficiency requires that it
A)levy a tax at the same rate to both firms.
B)choose a different tax rate for each firm so that each firm abates QR units of pollution.
C)impose the same tax on both firms and also fix the amount of pollution abatement at QR for each firm.
D)tax only the high-cost firm (Firm Y)and fix the amount of pollution abatement for the low-cost firm (Firm X).
E)tax only the low-cost firm (Firm X)and fix the amount of pollution abatement for the high -cost firm (Firm Y).
FIGURE 17-6Refer to Figure 17-6.Ignore the horizontal line at t.If the government wanted to impose an emissions tax,efficiency requires that it
A)levy a tax at the same rate to both firms.
B)choose a different tax rate for each firm so that each firm abates QR units of pollution.
C)impose the same tax on both firms and also fix the amount of pollution abatement at QR for each firm.
D)tax only the high-cost firm (Firm Y)and fix the amount of pollution abatement for the low-cost firm (Firm X).
E)tax only the low-cost firm (Firm X)and fix the amount of pollution abatement for the high -cost firm (Firm Y).
Unlock Deck
Unlock for access to all 126 flashcards in this deck.
Unlock Deck
k this deck
76
Why are direct controls for reducing pollution likely to be inefficient?
A)The cost of reducing pollution is greater than the benefit.
B)Direct controls are impossible to monitor.
C)Firms with different pollution abatement costs are facing identical regulations.
D)Firms are not likely to comply with this method of government intervention.
E)Firmsʹ output will rise above the socially optimal amount.
Unlock Deck
Unlock for access to all 126 flashcards in this deck.
Unlock Deck
k this deck
77
Which of the following environmental problems would be best addressed through the use of direct controls?
A)emissions from coal-fired electric generating stations that cause acid rain
B)CO2 emissions from ocean-going cruise ships
C)sulfur dioxide discharged from pulp and paper mills
D)the greenhouse gas emissions associated with residential home heating
E)a chemical additive in animal feed that pollutes groundwater and is toxic to humans
Unlock Deck
Unlock for access to all 126 flashcards in this deck.
Unlock Deck
k this deck
78
Direct pollution controls are usually inefficient because they
A)do not minimize the total cost of a given amount of abatement.
B)lead all firms to abate more pollution than the socially optimal amount.
C)lead all firms to abate less pollution than the socially optimal amount.
D)do not achieve the targeted amount of pollution abatement.
E)are controlling quantities of pollution abatement as opposed to prices.
Unlock Deck
Unlock for access to all 126 flashcards in this deck.
Unlock Deck
k this deck
79
The banning of wood-burning stoves and fireplaces is an example of
A)safety regulations.
B)emissions taxes.
C)tradable emissions standards.
D)direct pollution controls.
E)a market-based environmental policy.
A)safety regulations.
B)emissions taxes.
C)tradable emissions standards.
D)direct pollution controls.
E)a market-based environmental policy.
Unlock Deck
Unlock for access to all 126 flashcards in this deck.
Unlock Deck
k this deck
80
An important reason that direct controls are usually inefficient in reducing pollution is that
A)they create new pollution as they eliminate existing pollution.
B)different firms have different marginal costs of pollution abatement.
C)it costs too much to make sure that firms comply with the regulations.
D)they generally garner little political support and thus eventually fail.
E)firms have little incentive to comply with them.
Unlock Deck
Unlock for access to all 126 flashcards in this deck.
Unlock Deck
k this deck
Unlock Deck
Unlock for access to all 126 flashcards in this deck.


