Exam 17: The Economics of Environmental Protection
Exam 1: Economic Issues and Concepts104 Questions
Exam 2: Economic Theories, data, and Graphs115 Questions
Exam 3: Demand, supply, and Price90 Questions
Exam 4: Elasticity130 Questions
Exam 5: Price Controls and Market Efficiency83 Questions
Exam 6: Consumer Behaviour84 Questions
Exam 7: Producers in the Short Run139 Questions
Exam 8: Producers in the Long Run108 Questions
Exam 9: Competitive Markets145 Questions
Exam 10: Monopoly, cartels, and Price Discrimination88 Questions
Exam 11: Imperfect Competition and Strategic Behaviour111 Questions
Exam 12: Economic Efficiency and Public Policy72 Questions
Exam 13: How Factor Markets Work112 Questions
Exam 14: Labour Markets and Income Inequality67 Questions
Exam 16: Market Failures and Government Intervention115 Questions
Exam 17: The Economics of Environmental Protection126 Questions
Exam 18: Taxation and Public Expenditure111 Questions
Exam 19: What Macroeconomics Is All About114 Questions
Exam 20: The Measurement of National Income104 Questions
Exam 21: The Simplest Short-Run Macro Model63 Questions
Exam 22: Adding Government and Trade to the Simple Macro Model74 Questions
Exam 23: Output and Prices in the Short Run119 Questions
Exam 24: From the Short Run to the Long Run: the Adjustment of Factor Prices125 Questions
Exam 25: Long-Run Economic Growth118 Questions
Exam 26: Money and Banking102 Questions
Exam 27: Money, interest Rates, and Economic Activity95 Questions
Exam 28: Monetary Policy in Canada110 Questions
Exam 29: Inflation and Disinflation98 Questions
Exam 30: Unemployment Fluctuations and the Nairu111 Questions
Exam 31: Government Debt and Deficits91 Questions
Exam 32: The Gains From International Trade50 Questions
Exam 34: Exchange Rates and the Balance of Payments206 Questions
Select questions type
A paper mill discharges chemicals into a river which pollutes the shores of a downstream resort area.The private marginal cost,social marginal cost,and marginal benefit associated with the production of paper are given by the following equations: MCP = 5 + Q MCS = 10 + 2Q MB = 35 - 0.5Q.
The marginal external cost is ________ throughout the output range.
Free
(Multiple Choice)
4.8/5  (32)
(32)
Correct Answer: Verified
C
The figure below shows the marginal benefit to consumers,MB,the marginal cost to private firms,MCP,and the marginal cost to society,MCS,at each level of output of some good.
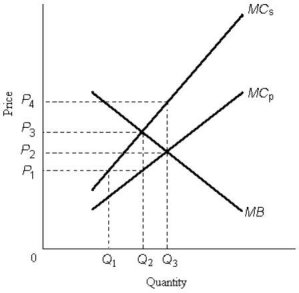 FIGURE 17-1
-Refer to Figure 17-1.The price that leads consumers to demand the socially optimal quantity of output is
FIGURE 17-1
-Refer to Figure 17-1.The price that leads consumers to demand the socially optimal quantity of output is
Free
(Multiple Choice)
4.8/5 (29)
Correct Answer:Verified
D
The table below shows the marginal benefit and marginal cost of pollution abatement for an economy. 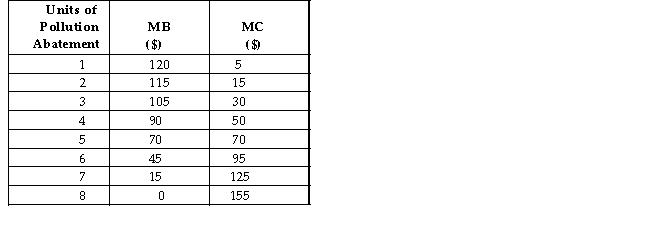 TABLE 17-1
-Refer to Table 17-1.Suppose a public authority has the mandate to maximize social welfare by choosing the appropriate amount of pollution abatement.The optimal amount of pollution abatement is ________ units and implies a ________ amount of pollution remaining
TABLE 17-1
-Refer to Table 17-1.Suppose a public authority has the mandate to maximize social welfare by choosing the appropriate amount of pollution abatement.The optimal amount of pollution abatement is ________ units and implies a ________ amount of pollution remaining
Free
(Multiple Choice)
4.9/5 (35)
Correct Answer:Verified
C
The diagram below shows the marginal costs of pollution abatement for two firms,Firm 1 and Firm 2.
 FIGURE 17-5
-Refer to Figure 17-5.How much pollution abatement would Firm 2 undertake if faced with an emissions tax of $20 per unit of emissions?
FIGURE 17-5
-Refer to Figure 17-5.How much pollution abatement would Firm 2 undertake if faced with an emissions tax of $20 per unit of emissions?
(Multiple Choice)
4.9/5 (34)
The diagram below shows the marginal cost of pollution abatement for two firms,Firm X and Firm Y.
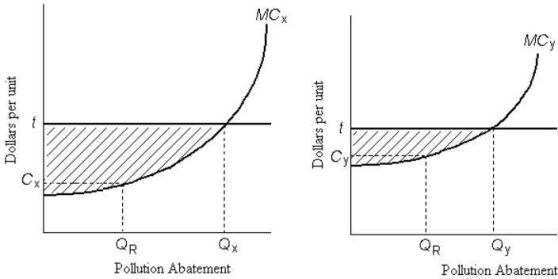 FIGURE 17-6
-Refer to Figure 17-6.Ignore the horizontal line at t.If the government wanted to impose an emissions tax,efficiency requires that it
FIGURE 17-6
-Refer to Figure 17-6.Ignore the horizontal line at t.If the government wanted to impose an emissions tax,efficiency requires that it
(Multiple Choice)
4.8/5 (35)
Consider a coal-fired electric-power plant that is operating under a cap-and trade-system.If its marginal cost of pollution abatement is $5 per unit and the price of the permit is $3 per unit,this firm will
(Multiple Choice)
4.9/5 (29)
The diagram below shows the marginal cost of pollution abatement for two firms,Firm X and Firm Y.
FIGURE 17-6
-Refer to Figure 17-6.Firms X and Y have an emissions tax of $t imposed on each unit of pollution they produce.If Firm X chooses to abate QX units of pollution,the total cost of its abatement is
(Multiple Choice)
4.8/5 (35)
Consider the following equation:
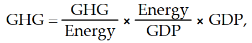 Where GHG = world annual emissions of greenhouse gases Energy = world annual amount of energy consumed GDP = worldʹs annual gross domestic product
Suppose GHG emissions increased by 10% between 2011 and 2015,a period when GDP increased by 5% and Energy/GDP was constant.We can conclude that GHG/Energy over the same period
Where GHG = world annual emissions of greenhouse gases Energy = world annual amount of energy consumed GDP = worldʹs annual gross domestic product
Suppose GHG emissions increased by 10% between 2011 and 2015,a period when GDP increased by 5% and Energy/GDP was constant.We can conclude that GHG/Energy over the same period
(Multiple Choice)
4.8/5 (32)
A paper mill discharges chemicals into a river which pollutes the shores of a downstream resort area.The private marginal cost,social marginal cost,and marginal benefit associated with the production of paper are given by the following equations: MCP = 5 + Q MCS = 10 + 2Q MB = 35 - 0.5Q.
The marginal external cost at the competitive free-market equilibrium is
(Multiple Choice)
4.9/5 (33)
The diagram below shows the marginal costs of pollution abatement for two firms,Firm 1 and Firm 2.
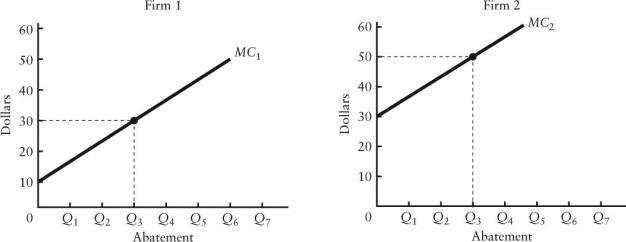 FIGURE 17-5
-Refer to Figure 17-5.Suppose the government requires that each firm abate pollution to the level Q 3.The outcome would be efficient because
FIGURE 17-5
-Refer to Figure 17-5.Suppose the government requires that each firm abate pollution to the level Q 3.The outcome would be efficient because
(Multiple Choice)
4.8/5 (29)
The diagram below shows the marginal cost of abatement for each of two firms,A and B.Each firm is initially abating Q 0 units of pollution.
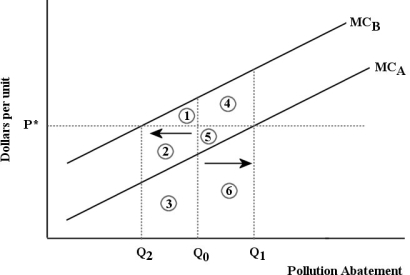 FIGURE 17-7
-Refer to Figure 17-7.Suppose that a system of tradable pollution permits is introduced into this market and the equilibrium permit price is p∗.Firm A will sell permits to Firm B because
FIGURE 17-7
-Refer to Figure 17-7.Suppose that a system of tradable pollution permits is introduced into this market and the equilibrium permit price is p∗.Firm A will sell permits to Firm B because
(Multiple Choice)
4.8/5 (34)
The marginal benefit of reducing pollution in some industry may be expected to
(Multiple Choice)
4.7/5 (38)
When considering an entire industry,the marginal benefit of reducing pollution is expected
(Multiple Choice)
4.7/5 (42)
The figure below shows the marginal benefit to consumers,MB,the marginal cost to private firms,MCP,and the marginal cost to society,MCS,at each level of output of some good.
FIGURE 17-1
-Refer to Figure 17-1.A negative externality is depicted because the
(Multiple Choice)
4.8/5 (47)
Consider global greenhouse-gas emissions.Suppose that in 2016,greenhouse gases emitted per unit of energy consumed decreased by 2%,energy use per unit of GDP decreased by 2%,and world GDP increased by 4%.What will be the approximate change in global greenhouse gas emissions in 2012?
(Multiple Choice)
4.8/5 (39)
Consider two firms,A and B,that must engage in pollution abatement.If Firm A has a lower marginal cost of pollution abatement than Firm B,then
(Multiple Choice)
4.8/5 (42)
The diagram below shows a market for tradable pollution permits.
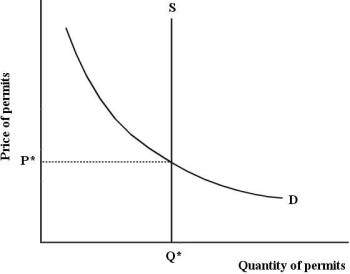 FIGURE 17-8
-Refer to Figure 17-8,which depicts the market for tradable pollution permits.The equilibrium price p*
FIGURE 17-8
-Refer to Figure 17-8,which depicts the market for tradable pollution permits.The equilibrium price p*
(Multiple Choice)
4.7/5 (39)
Direct controls for reducing pollution can be criticized from an economic viewpoint as
(Multiple Choice)
5.0/5 (41)
Zero pollution is almost surely NOT a desirable social goal because
(Multiple Choice)
4.9/5 (38)
Suppose the government imposes an emissions tax of $t on each unit of pollution produced by a firm.Under which of the following circumstances would the tax rate be set too high to achieve allocative efficiency?
(Multiple Choice)
4.9/5 (37)
Filters
- Essay(0)
- Multiple Choice(0)
- Short Answer(0)
- True False(0)
- Matching(0)