Deck 2: Economic Theories, Data, and Graphs
Full screen (f)
Question
Question
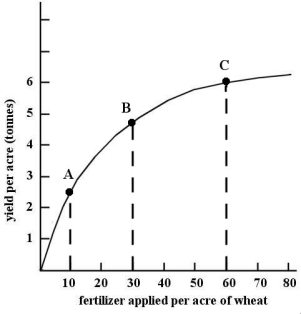 FIGURE 2- 4
Refer to Figure 2- 4. The slope of the non- linear function changes as we move along the curve. The slope is
A) negative and decreasing, indicating a diminishing marginal response.
B) constant at all points, indicating a constant marginal response.
C) negative and increasing, indicating an increasing marginal response.
D) positive and increasing, indicating an increasing marginal response.
E) positive and decreasing, indicating a diminishing marginal response.
Question
Question
Question
Question
Question
Question
Question
Question
Question
 FIGURE 2- 3
Refer to Figure 2- 3. The slope of curve B is
A) negative from Y1 to Y2 and positive between Y2 and Y3.
B) undefined at X2.
C) always negative but variable.
D) zero at X2.
E) always positive but variable.
Question
Question
 FIGURE 2- 2
Refer to Figure 2- 2. The slope of curve D is
A) positive and constant.
B) undefined.
C) negative and constant.
D) positive and changing.
E) negative and changing.
Question
Question
Question
Question
 FIGURE 2- 3
Refer to Figure 2- 3. The slope of curve A is
A) positive and variable.
B) positive from X1 to X2 and negative from X2 to X3.
C) zero.
D) negative from X1 to X2 and positive from X2 to X3.
E) negative and variable.
Question
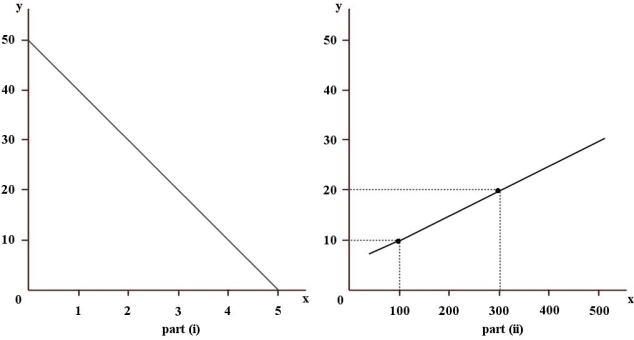 FIGURE 2- 1
Refer to Figure 2- 1. What is the slope of the line in part (ii) of the figure?
A) 12.5
B) 0.08
C) 0.05
D) 1
E) - 12.5
Question
 FIGURE 2- 3
Refer to Figure 2- 3. At X2 on curve A , the
A) minimum occurs at Y4.
B) slope is increasing.
C) maximum occurs at Y1.
D) slope of the curve is zero.
E) slope is decreasing.
Question
Question
Question
Question
Question
Question
Question
Question
Question
Question
Question
Question
Question
Question
Question
 FIGURE 2- 4
Refer to Figure 2- 4. This non- linear function shows that over the range shown,
A) as the yield per acre increases, the amount of fertilizer required per acre is diminishing.
B) as the yield per acre increases, the amount of fertilizer required per acre is increasing.
C) as more fertilizer is applied, the marginal response in yield is increasing
D) as more fertilizer is applied, the marginal change in yield is diminishing.
E) as more fertilizer is applied, the total yield per acre is diminishing.
Question
Question
Question
Question
Question
Question
Question
Question
Question
Question
Question
Question
 FIGURE 2- 4
Refer to Figure 2- 4. If we want to know the marginal response of "yield per acre" due to a change in "fertilizer applied per acre of wheat" at point B, then we should determine the
A) slope of a straight line tangent to point B.
B) quantity of fertilizer applied at point B.
C) slope of a straight line joining points B and C.
D) yield per acre at 30 units of fertilizer.
E) the slope of a straight line from the origin to point B.
Question
Question
 FIGURE 2- 2
Refer to Figure 2- 2. The slope of curve C is
A) negative and constant.
B) negative and changing.
C) impossible to describe.
D) positive and constant.
E) positive and changing.
Question
Question
Question
Question
Question
Question
Question
Question
Question
Question
Question
Question
Question
Question
Question
Question
Let 1 stand for "any given period" and 2 stand for "base period". The formula of any index number can be written as: 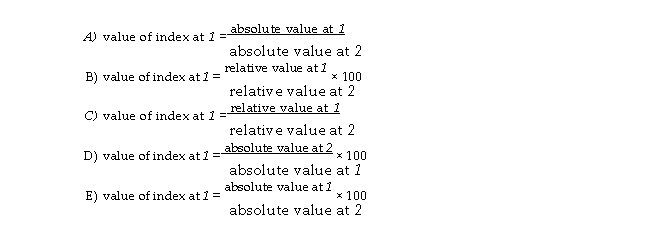
Question
Question
Question
Question
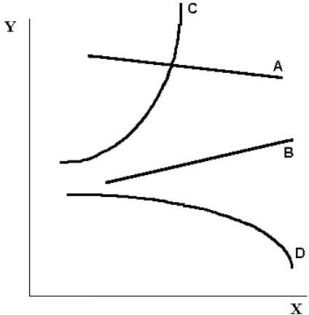 FIGURE 2- 2
Refer to Figure 2- 2. The slope of curve A is
A) negative and constant.
B) positive and constant.
C) undefined.
D) negative and changing.
E) positive and changing.
Question
Question
Question
Question
Question
Question
Question
 FIGURE 2- 2
Refer to Figure 2- 2. The slope of curve B is
A) undefined.
B) negative and changing.
C) negative and constant.
D) positive and changing.
E) positive and constant.
Question
Question
Question
Question
Question

Unlock Deck
Sign up to unlock the cards in this deck!
Unlock Deck
Unlock Deck
1/114
Play
Full screen (f)
Deck 2: Economic Theories, Data, and Graphs
1
An economic theory
A) will be useful only if all human behaviour is rational.
B) will be useful as long as it is logically consistent.
C) is only useful if its underlying assumptions are realistic.
D) will predict more accurately if it contains a greater number of mathematical equations.
E) must be judged on its ability to explain and predict real- world phenomena.
E
2
FIGURE 2- 4Refer to Figure 2- 4. The slope of the non- linear function changes as we move along the curve. The slope is
A) negative and decreasing, indicating a diminishing marginal response.
B) constant at all points, indicating a constant marginal response.
C) negative and increasing, indicating an increasing marginal response.
D) positive and increasing, indicating an increasing marginal response.
E) positive and decreasing, indicating a diminishing marginal response.
E
3
Of the following, which is the most important characteristic of a successful theory?
A) the theory could never be refuted.
B) the theory allows us to predict behaviour reasonably accurately.
C) all assumptions on which the theory is based are true.
D) the theory adequately explains all economic behaviour.
E) the theory provides a basis for facts about economic behaviour.
A) the theory could never be refuted.
B) the theory allows us to predict behaviour reasonably accurately.
C) all assumptions on which the theory is based are true.
D) the theory adequately explains all economic behaviour.
E) the theory provides a basis for facts about economic behaviour.
B
4
Choose the answer that best explains why economists build models that abstract from the complexities of reality.
A) Because the complexities of reality are unimportant.
B) Because economists are not interested in reality.
C) Because this allows economists to conduct controlled experiments to test their theories.
D) Because they believe they gain a greater understanding of reality.
E) Because economics deals only in the abstract.
Unlock Deck
Unlock for access to all 114 flashcards in this deck.
Unlock Deck
k this deck
5
The table below shows hypothetical tuition costs at a Canadian university.
-Refer to Table 2- 1. Assume that 2005 is used as the base year, with the index number = 100. The value of the index number in 2007 is calculated as follows:
A) (5000/5100) × 100 = 98
B) (5100/5000) × 100 = 102
C) 5100/5000 = 1.02
D) 5100/5100 = 100
E) 5000/5100 = 0.98
-Refer to Table 2- 1. Assume that 2005 is used as the base year, with the index number = 100. The value of the index number in 2007 is calculated as follows:
A) (5000/5100) × 100 = 98
B) (5100/5000) × 100 = 102
C) 5100/5000 = 1.02
D) 5100/5100 = 100
E) 5000/5100 = 0.98
Unlock Deck
Unlock for access to all 114 flashcards in this deck.
Unlock Deck
k this deck
6
Suppose there is a theory that several things influence the price of fish in Halifax, one of which is the weather during the fishing season. When examining the determinants of the price of fish, the weather is
A) a stock, as it influences the quantity of fish caught.
B) an endogenous variable, as it influences the price of fish.
C) an endogenous variable, as it is determined within the theory.
D) an exogenous variable, as it is determined outside the theory.
E) an act of God and, therefore, has no legitimate connection with the theory.
Unlock Deck
Unlock for access to all 114 flashcards in this deck.
Unlock Deck
k this deck
7
An index number is used to
A) compare the same variable in two different situations.
B) compare two different variables in two different situations.
C) designate a specific value for further reference.
D) compare two different variables in the same situation.
E) measure the absolute value of a variable.
A) compare the same variable in two different situations.
B) compare two different variables in two different situations.
C) designate a specific value for further reference.
D) compare two different variables in the same situation.
E) measure the absolute value of a variable.
Unlock Deck
Unlock for access to all 114 flashcards in this deck.
Unlock Deck
k this deck
8
Which of the following is a normative statement?
A) Tuition fees should be waived for low- income students.
B) A free- trade agreement between two countries will result in an increase in trade.
C) The higher is the level of taxes, the higher are wage demands.
D) A reduction in export taxes on petroleum would result in higher wages.
E) The higher is the level of taxes, the lower is consumption spending.
Unlock Deck
Unlock for access to all 114 flashcards in this deck.
Unlock Deck
k this deck
9
A hypothesis (or a prediction) is a statement about
A) how assumptions affect theories.
B) what will happen in the future.
C) those things which we believe to be true, but cannot prove.
D) the relationship between facts explained by the hypothesis.
E) how two or more variables are related to each other.
A) how assumptions affect theories.
B) what will happen in the future.
C) those things which we believe to be true, but cannot prove.
D) the relationship between facts explained by the hypothesis.
E) how two or more variables are related to each other.
Unlock Deck
Unlock for access to all 114 flashcards in this deck.
Unlock Deck
k this deck
10
The slope of a straight line is necessarily
A) negative.
B) zero.
C) positive.
D) constant.
E) increasing as one moves up the line.
A) negative.
B) zero.
C) positive.
D) constant.
E) increasing as one moves up the line.
Unlock Deck
Unlock for access to all 114 flashcards in this deck.
Unlock Deck
k this deck
11
FIGURE 2- 3Refer to Figure 2- 3. The slope of curve B is
A) negative from Y1 to Y2 and positive between Y2 and Y3.
B) undefined at X2.
C) always negative but variable.
D) zero at X2.
E) always positive but variable.
Unlock Deck
Unlock for access to all 114 flashcards in this deck.
Unlock Deck
k this deck
12
Suppose an individual wheat farmer's income is influenced by the region's average daily temperature. When examining the determinants of individual farmer income, the average daily temperature is a(n) variable.
A) flow
B) induced
C) dependent
D) endogenous
E) exogenous
A) flow
B) induced
C) dependent
D) endogenous
E) exogenous
Unlock Deck
Unlock for access to all 114 flashcards in this deck.
Unlock Deck
k this deck
13
FIGURE 2- 2Refer to Figure 2- 2. The slope of curve D is
A) positive and constant.
B) undefined.
C) negative and constant.
D) positive and changing.
E) negative and changing.
Unlock Deck
Unlock for access to all 114 flashcards in this deck.
Unlock Deck
k this deck
14
Economic theories
A) can be used to help explain and predict economic behaviour.
B) cannot be tested because we cannot do economic "experiments".
C) must apply to all economies to be true.
D) are not useful because of the unrealistic assumptions they contain.
E) cannot help to predict future behaviour.
A) can be used to help explain and predict economic behaviour.
B) cannot be tested because we cannot do economic "experiments".
C) must apply to all economies to be true.
D) are not useful because of the unrealistic assumptions they contain.
E) cannot help to predict future behaviour.
Unlock Deck
Unlock for access to all 114 flashcards in this deck.
Unlock Deck
k this deck
15
The table below shows hypothetical per- minute cell phone charges for "pay- and- talk" service over several years.
-Refer to Table 2- 2. Assume that 2005 is used as the base year, with the index number = 100. Which of the following series is the correct set of index numbers for the per- minute cell phone charges from 2005 to 2009?
A) 1.0; 0.91; 0.73; 0.64; 0.45
B) 100; 91; 73; 64; 45
C) 0.55; 0.50; 0.40; 0.35; 0.25
D) 100%; 91%; 73%; 64% 45%
E) 55; 50; 40; 35; 25
Unlock Deck
Unlock for access to all 114 flashcards in this deck.
Unlock Deck
k this deck
16
What is the best way to display the unemployment rate in each of the world's developed economies in 2009?
A) a scatter diagram with two variables
B) a cross- sectional graph with time- series data
C) a cross- sectional bar chart graph
D) a scatter diagram
E) a time series line graph
A) a scatter diagram with two variables
B) a cross- sectional graph with time- series data
C) a cross- sectional bar chart graph
D) a scatter diagram
E) a time series line graph
Unlock Deck
Unlock for access to all 114 flashcards in this deck.
Unlock Deck
k this deck
17
FIGURE 2- 3Refer to Figure 2- 3. The slope of curve A is
A) positive and variable.
B) positive from X1 to X2 and negative from X2 to X3.
C) zero.
D) negative from X1 to X2 and positive from X2 to X3.
E) negative and variable.
Unlock Deck
Unlock for access to all 114 flashcards in this deck.
Unlock Deck
k this deck
18
FIGURE 2- 1Refer to Figure 2- 1. What is the slope of the line in part (ii) of the figure?
A) 12.5
B) 0.08
C) 0.05
D) 1
E) - 12.5
Unlock Deck
Unlock for access to all 114 flashcards in this deck.
Unlock Deck
k this deck
19
FIGURE 2- 3Refer to Figure 2- 3. At X2 on curve A , the
A) minimum occurs at Y4.
B) slope is increasing.
C) maximum occurs at Y1.
D) slope of the curve is zero.
E) slope is decreasing.
Unlock Deck
Unlock for access to all 114 flashcards in this deck.
Unlock Deck
k this deck
20
An economic theory requires, among other things,
A) a set of value judgments to interpret the empirical evidence.
B) a controlled laboratory setting in which the theory can be tested.
C) that the set of predictions be correct.
D) a set of definitions of the variables to be considered.
E) the use of endogenous variables only.
A) a set of value judgments to interpret the empirical evidence.
B) a controlled laboratory setting in which the theory can be tested.
C) that the set of predictions be correct.
D) a set of definitions of the variables to be considered.
E) the use of endogenous variables only.
Unlock Deck
Unlock for access to all 114 flashcards in this deck.
Unlock Deck
k this deck
21
Economists build models that abstract from the complexities of reality because
A) economists do not understand the real world.
B) economists are not interested in reality.
C) it is easier to do so.
D) the complexities of reality are unimportant.
E) they believe they gain a greater understanding of reality.
A) economists do not understand the real world.
B) economists are not interested in reality.
C) it is easier to do so.
D) the complexities of reality are unimportant.
E) they believe they gain a greater understanding of reality.
Unlock Deck
Unlock for access to all 114 flashcards in this deck.
Unlock Deck
k this deck
22
Suppose that a particular theory predicts that on sunny days consumption of ice cream will rise and that on cloudy days consumption of ice cream will fall. If an economist tests this theory and finds that over a six- month period the theory predicts accurately, the economist would likely say
A) the evidence fails to reject the theory.
B) the theory has been proven correct.
C) the theory is always reliable.
D) that the theory is not useful because consumption involves irrational human behaviour.
E) the theory shouldn't be taken seriously.
A) the evidence fails to reject the theory.
B) the theory has been proven correct.
C) the theory is always reliable.
D) that the theory is not useful because consumption involves irrational human behaviour.
E) the theory shouldn't be taken seriously.
Unlock Deck
Unlock for access to all 114 flashcards in this deck.
Unlock Deck
k this deck
23
The statement that a two- percent increase in the money supply leads to a two- percent increase in the price level is an example of a(n)
A) variable.
B) prediction.
C) normative statement.
D) model.
E) assumption.
A) variable.
B) prediction.
C) normative statement.
D) model.
E) assumption.
Unlock Deck
Unlock for access to all 114 flashcards in this deck.
Unlock Deck
k this deck
24
Which of the following best describes the relationship between positive and normative statements in economics?
A) Positive and normative statements are alternate ways of describing the desirability of certain economic policies.
B) Normative statements evaluate the desirability of certain economic changes; positive statements do not.
C) Economists generally agree with each other regardless of whether a question is positive or normative.
D) Neither positive nor normative statements are concerned with the desirability of certain economic changes.
E) Normative statements are those with which all economists agree; positive statements may give rise to some disagreement.
Unlock Deck
Unlock for access to all 114 flashcards in this deck.
Unlock Deck
k this deck
25
A theory
A) can only be tested with a controlled experiment.
B) is designed to explain and predict what we observe.
C) is used to impose order on the world.
D) assumes definitions for variables.
E) enables one to make prophesies about the future.
A) can only be tested with a controlled experiment.
B) is designed to explain and predict what we observe.
C) is used to impose order on the world.
D) assumes definitions for variables.
E) enables one to make prophesies about the future.
Unlock Deck
Unlock for access to all 114 flashcards in this deck.
Unlock Deck
k this deck
26
When an increase in one variable is associated with a decrease in a second variable, the two variables are
A) positively related.
B) inversely proportionally related.
C) equivalent.
D) proportionally related.
E) negatively related.
A) positively related.
B) inversely proportionally related.
C) equivalent.
D) proportionally related.
E) negatively related.
Unlock Deck
Unlock for access to all 114 flashcards in this deck.
Unlock Deck
k this deck
27
A positive statement is one that states
A) non- negative numbers.
B) what is desirable.
C) what is, was, or will be.
D) what is and what should be.
E) what should be but is not.
A) non- negative numbers.
B) what is desirable.
C) what is, was, or will be.
D) what is and what should be.
E) what should be but is not.
Unlock Deck
Unlock for access to all 114 flashcards in this deck.
Unlock Deck
k this deck
28
If the graph of a function is a horizontal line, the slope of this line is
A) infinity.
B) undefined.
C) - 1.
D) 0.
E) 1.
A) infinity.
B) undefined.
C) - 1.
D) 0.
E) 1.
Unlock Deck
Unlock for access to all 114 flashcards in this deck.
Unlock Deck
k this deck
29
On a coordinate graph, what is the X intercept of the function X = 60 + 3Y?
A) - 60
B) 0
C) 60
D) - 20
E) 20
A) - 60
B) 0
C) 60
D) - 20
E) 20
Unlock Deck
Unlock for access to all 114 flashcards in this deck.
Unlock Deck
k this deck
30
An unweighted index number
A) has different weights for each data series depending on importance.
B) has equal weights attached to different data series.
C) has no weights attached to different data series.
D) is not a real index number.
E) can only be used for price indexes.
A) has different weights for each data series depending on importance.
B) has equal weights attached to different data series.
C) has no weights attached to different data series.
D) is not a real index number.
E) can only be used for price indexes.
Unlock Deck
Unlock for access to all 114 flashcards in this deck.
Unlock Deck
k this deck
31
The statement that a country's rate of GDP growth is influenced by individuals' saving behaviour is an example of a(n)
A) economic law.
B) theory.
C) prediction.
D) variable.
E) normative statement.
A) economic law.
B) theory.
C) prediction.
D) variable.
E) normative statement.
Unlock Deck
Unlock for access to all 114 flashcards in this deck.
Unlock Deck
k this deck
32
Which of the following statements is NOT correct?
A) Exposing them to empirical evidence can best test positive statements.
B) Economic statements cannot be tested because human decisions involve free will.
C) Economists test their theories by confronting the predictions of their theories with the evidence drawn from the real world.
D) Economic predictions will be fulfilled when their underlying hypotheses conform to actual human behaviour.
E) Normative statements cannot be tested by the scientific method.
Unlock Deck
Unlock for access to all 114 flashcards in this deck.
Unlock Deck
k this deck
33
Suppose point A represents coordinates (X = 2, Y = 12) and point B represents coordinates (X = 6, Y
= 4). The slope of the straight line joining points A and B is
A) - 2.
B) 5.
C) 2.
D) - 1 .
E) 1 . 2 2
= 4). The slope of the straight line joining points A and B is
A) - 2.
B) 5.
C) 2.
D) - 1 .
E) 1 . 2 2
Unlock Deck
Unlock for access to all 114 flashcards in this deck.
Unlock Deck
k this deck
34
FIGURE 2- 4Refer to Figure 2- 4. This non- linear function shows that over the range shown,
A) as the yield per acre increases, the amount of fertilizer required per acre is diminishing.
B) as the yield per acre increases, the amount of fertilizer required per acre is increasing.
C) as more fertilizer is applied, the marginal response in yield is increasing
D) as more fertilizer is applied, the marginal change in yield is diminishing.
E) as more fertilizer is applied, the total yield per acre is diminishing.
Unlock Deck
Unlock for access to all 114 flashcards in this deck.
Unlock Deck
k this deck
35
Consider the line which is the graph of the function Y = 60 - 4X. The slope of this line is
A) 60.
B) - 2.5.
C) - 40.
D) - 4.0.
E) 4.
A) 60.
B) - 2.5.
C) - 40.
D) - 4.0.
E) 4.
Unlock Deck
Unlock for access to all 114 flashcards in this deck.
Unlock Deck
k this deck
36
Suppose economists at the World Bank discover a positive correlation between family income and female education levels in developing countries. We can say that
A) there is a causal relationship between family income and female education.
B) the correlation is inconsistent with a theory that an increase in female education levels causes an increase in family income.
C) an increase in family income causes an increase in female education levels.
D) the observed correlation is consistent with a theory that an increase in female education levels causes an increase in family income.
E) an increase in female education levels causes an increase in family incomes.
Unlock Deck
Unlock for access to all 114 flashcards in this deck.
Unlock Deck
k this deck
37
Suppose an economist tells you that the unemployment rate in Canada last year was 7.8 percent. This is an example of a(n) statement.
A) autonomous
B) positive
C) induced
D) imputed
E) normative
A) autonomous
B) positive
C) induced
D) imputed
E) normative
Unlock Deck
Unlock for access to all 114 flashcards in this deck.
Unlock Deck
k this deck
38
As a science, economics is disadvantaged in that
A) it is usually not possible to conduct controlled experiments in economics, in contrast with certain other sciences.
B) some economic variables are determined within the theory.
C) economic hypotheses cannot be accepted with complete certainty, by contrast with the other sciences.
D) it deals with human behaviour and thus is not open to empirical testing.
E) economic variables do not change enough to provide reliable data for testing hypotheses.
Unlock Deck
Unlock for access to all 114 flashcards in this deck.
Unlock Deck
k this deck
39
Suppose that a particular theory predicts that on Monday, Wednesday, and Friday the stock market will rise and that on Tuesday and Thursday the stock market will fall. If an economist tests this theory and finds that over a six- month period the theory predicts accurately, the economist would likely say that the theory
A) has been proven correct.
B) is not rejected by the evidence.
C) is not useful because stock markets involve irrational human behaviour.
D) is reliable.
E) shouldn't be taken seriously.
A) has been proven correct.
B) is not rejected by the evidence.
C) is not useful because stock markets involve irrational human behaviour.
D) is reliable.
E) shouldn't be taken seriously.
Unlock Deck
Unlock for access to all 114 flashcards in this deck.
Unlock Deck
k this deck
40
The table below shows hypothetical tuition costs at a Canadian university.
-Refer to Table 2- 1. The increase in tuition from 2005 to 2009 is:
A) 4 percent.
B) 100/5000.
C) 200.
D) 0.04 percent.
E) 200/5200.
-Refer to Table 2- 1. The increase in tuition from 2005 to 2009 is:
A) 4 percent.
B) 100/5000.
C) 200.
D) 0.04 percent.
E) 200/5200.
Unlock Deck
Unlock for access to all 114 flashcards in this deck.
Unlock Deck
k this deck
41
When considering how a family's level of consumption changes in response to changes in its income,
A) consumption is the dependent variable and income is the independent variable.
B) both of the variables are independent.
C) income is the dependent variable and family consumption is the independent variable.
D) there is no relationship between the variables.
E) both of the variables are dependent.
Unlock Deck
Unlock for access to all 114 flashcards in this deck.
Unlock Deck
k this deck
42
The scientific approach to economic inquiry involves
A) testing the predictions with empirical data.
B) choosing data that will support the predictions.
C) using only independent variables.
D) testing the reality of the assumptions of the model.
E) using only endogenous variables in economic models.
A) testing the predictions with empirical data.
B) choosing data that will support the predictions.
C) using only independent variables.
D) testing the reality of the assumptions of the model.
E) using only endogenous variables in economic models.
Unlock Deck
Unlock for access to all 114 flashcards in this deck.
Unlock Deck
k this deck
43
The table below shows hypothetical per- minute cell phone charges for "pay- and- talk" service over several years.
-Refer to Table 2- 2. Assume that 2005 is used as the base year, with the index number = 100. The value of the index number in 2008 is calculated as follows:
A) (0.55/0.35) × 100 = 157.14
B) (0.35/0.55) × 100 = 63.64
C) 0.35/0.55 = 0.64
D) 0.35 × 100 = 35
E) 0.55/0.35 = 1.57
-Refer to Table 2- 2. Assume that 2005 is used as the base year, with the index number = 100. The value of the index number in 2008 is calculated as follows:
A) (0.55/0.35) × 100 = 157.14
B) (0.35/0.55) × 100 = 63.64
C) 0.35/0.55 = 0.64
D) 0.35 × 100 = 35
E) 0.55/0.35 = 1.57
Unlock Deck
Unlock for access to all 114 flashcards in this deck.
Unlock Deck
k this deck
44
Which of the following is a normative statement?
A) Reducing unemployment is more important than reducing inflation.
B) Queen Elizabeth II is the wealthiest woman in the world.
C) The sun rises in the west and sets in the east.
D) A government deficit will reduce unemployment and cause an increase in prices.
E) An increase in the price of lumber is followed by a decrease in the construction of new houses.
Unlock Deck
Unlock for access to all 114 flashcards in this deck.
Unlock Deck
k this deck
45
Data collected repeatedly over successive periods of time are called
A) logarithmic data.
B) time- analysis data.
C) topographic data.
D) cross- sectional data.
E) time- series data.
A) logarithmic data.
B) time- analysis data.
C) topographic data.
D) cross- sectional data.
E) time- series data.
Unlock Deck
Unlock for access to all 114 flashcards in this deck.
Unlock Deck
k this deck
46
FIGURE 2- 4Refer to Figure 2- 4. If we want to know the marginal response of "yield per acre" due to a change in "fertilizer applied per acre of wheat" at point B, then we should determine the
A) slope of a straight line tangent to point B.
B) quantity of fertilizer applied at point B.
C) slope of a straight line joining points B and C.
D) yield per acre at 30 units of fertilizer.
E) the slope of a straight line from the origin to point B.
Unlock Deck
Unlock for access to all 114 flashcards in this deck.
Unlock Deck
k this deck
47
The statement that introducing a policy of legislated rent controls will lead to a housing shortage is an example of a(n)
A) model.
B) normative statement.
C) theory.
D) prediction.
E) assumption.
A) model.
B) normative statement.
C) theory.
D) prediction.
E) assumption.
Unlock Deck
Unlock for access to all 114 flashcards in this deck.
Unlock Deck
k this deck
48
FIGURE 2- 2Refer to Figure 2- 2. The slope of curve C is
A) negative and constant.
B) negative and changing.
C) impossible to describe.
D) positive and constant.
E) positive and changing.
Unlock Deck
Unlock for access to all 114 flashcards in this deck.
Unlock Deck
k this deck
49
Suppose that two points on a straight line are (X = 4, Y = 5), and (X = 2, Y = 1). The slope of this line is
A) 1 .
B) 4 .
C) - 1 .
D) - 2.
E) 2. 2 5 2
A) 1 .
B) 4 .
C) - 1 .
D) - 2.
E) 2. 2 5 2
Unlock Deck
Unlock for access to all 114 flashcards in this deck.
Unlock Deck
k this deck
50
Most economists believe that economics be made completely value- free, in part because it is to absolutely refute a theory on the basis of factual evidence.
A) can; possible
B) can; impossible
C) cannot; impossible
D) will; necessary
E) cannot; possible
A) can; possible
B) can; impossible
C) cannot; impossible
D) will; necessary
E) cannot; possible
Unlock Deck
Unlock for access to all 114 flashcards in this deck.
Unlock Deck
k this deck
51
Each of the following is an example of a hypothesis EXCEPT:
A) If the price of a movie ticket increases, then John will attend fewer movies.
B) If the movie is starring Harrison Ford, then Charles and John will both attend.
C) Charles does not enjoy movies.
D) If Charles attends the movie, then John will not attend.
E) If the theatre catches on fire, then people will leave the theatre.
Unlock Deck
Unlock for access to all 114 flashcards in this deck.
Unlock Deck
k this deck
52
A scientific prediction is
A) a conditional statement of the following form: if A occurs, then B will follow.
B) a prophesy of how the future will unfold.
C) a causal statement of the following form: A will occur because B occurred.
D) always based on the law of large numbers.
E) not testable.
A) a conditional statement of the following form: if A occurs, then B will follow.
B) a prophesy of how the future will unfold.
C) a causal statement of the following form: A will occur because B occurred.
D) always based on the law of large numbers.
E) not testable.
Unlock Deck
Unlock for access to all 114 flashcards in this deck.
Unlock Deck
k this deck
53
An assertion about the desirability of reducing unemployment by lowering payroll taxes is most likely
A) a normative statement.
B) a hypothesis.
C) a testable proposition.
D) a theory.
E) a positive statement.
A) a normative statement.
B) a hypothesis.
C) a testable proposition.
D) a theory.
E) a positive statement.
Unlock Deck
Unlock for access to all 114 flashcards in this deck.
Unlock Deck
k this deck
54
The use of statistics in economics is
A) to test predictions and to estimate the values of variables in economic theories.
B) to study how the economic system should perform basic economic functions.
C) to model nature.
D) for descriptive purposes only.
E) entirely devoid of ethical judgments.
A) to test predictions and to estimate the values of variables in economic theories.
B) to study how the economic system should perform basic economic functions.
C) to model nature.
D) for descriptive purposes only.
E) entirely devoid of ethical judgments.
Unlock Deck
Unlock for access to all 114 flashcards in this deck.
Unlock Deck
k this deck
55
In order to test a theory, one must
A) present a series of normative statements and positive statements.
B) confront the predictions of the theory with evidence.
C) develop normative statements from the law of large numbers.
D) develop a better explanation than the one presented.
E) use assumptions that most closely reflect reality.
A) present a series of normative statements and positive statements.
B) confront the predictions of the theory with evidence.
C) develop normative statements from the law of large numbers.
D) develop a better explanation than the one presented.
E) use assumptions that most closely reflect reality.
Unlock Deck
Unlock for access to all 114 flashcards in this deck.
Unlock Deck
k this deck
56
When comparing the magnitude of changes in variables with different scales it is best to
A) express each variable as an index number.
B) use only time- series data.
C) express each variable as a logarithmic number.
D) compare the absolute data on each variable.
E) compare the relative data on each variable.
A) express each variable as an index number.
B) use only time- series data.
C) express each variable as a logarithmic number.
D) compare the absolute data on each variable.
E) compare the relative data on each variable.
Unlock Deck
Unlock for access to all 114 flashcards in this deck.
Unlock Deck
k this deck
57
Data collected of several variables but for the same time period are called
A) time- series data.
B) logarithmic data.
C) topographic data.
D) cross- sectional data.
E) time- analysis data.
A) time- series data.
B) logarithmic data.
C) topographic data.
D) cross- sectional data.
E) time- analysis data.
Unlock Deck
Unlock for access to all 114 flashcards in this deck.
Unlock Deck
k this deck
58
An economist has data showing household income and energy consumption for 10 000 Canadian households. The best way to illustrate these data is
A) a logarithmic scale diagram.
B) a cross- sectional bar- chart graph.
C) a time- series bar chart diagram.
D) a time- series line graph.
E) a scatter diagram.
A) a logarithmic scale diagram.
B) a cross- sectional bar- chart graph.
C) a time- series bar chart diagram.
D) a time- series line graph.
E) a scatter diagram.
Unlock Deck
Unlock for access to all 114 flashcards in this deck.
Unlock Deck
k this deck
59
Which of the following pairs of words have similar meanings?
A) induced and exogenous
B) dependent and exogenous
C) independent and exogenous
D) induced and autonomous
E) endogenous and autonomous
A) induced and exogenous
B) dependent and exogenous
C) independent and exogenous
D) induced and autonomous
E) endogenous and autonomous
Unlock Deck
Unlock for access to all 114 flashcards in this deck.
Unlock Deck
k this deck
60
Disagreements over positive statements
A) are basically devoid of any emotion.
B) arise from the failure to distinguish between a positive and a normative statement.
C) cannot arise because positive statements are facts.
D) never occur.
E) are best handled by an appeal to the facts.
A) are basically devoid of any emotion.
B) arise from the failure to distinguish between a positive and a normative statement.
C) cannot arise because positive statements are facts.
D) never occur.
E) are best handled by an appeal to the facts.
Unlock Deck
Unlock for access to all 114 flashcards in this deck.
Unlock Deck
k this deck
61
A normative statement
A) is one that involves a value judgment.
B) has no place in the study and practice of economics.
C) concerns what is provable.
D) can be derived logically from facts.
E) is a statement that is empirically testable.
A) is one that involves a value judgment.
B) has no place in the study and practice of economics.
C) concerns what is provable.
D) can be derived logically from facts.
E) is a statement that is empirically testable.
Unlock Deck
Unlock for access to all 114 flashcards in this deck.
Unlock Deck
k this deck
62
The mathematical expression of a relationship between two or more variables is usually known as
A) a theory.
B) a function.
C) a definition.
D) an observation.
E) an assumption.
A) a theory.
B) a function.
C) a definition.
D) an observation.
E) an assumption.
Unlock Deck
Unlock for access to all 114 flashcards in this deck.
Unlock Deck
k this deck
63
Consider the following equation: Y = 10 + 5X - X2. This equation is an expression of
A) two dependent variables in a functional relation.
B) two independent variables in a functional relation.
C) a functional relation in a verbal format.
D) a functional relation between X and Y.
E) a functional relation in a schedule format.
A) two dependent variables in a functional relation.
B) two independent variables in a functional relation.
C) a functional relation in a verbal format.
D) a functional relation between X and Y.
E) a functional relation in a schedule format.
Unlock Deck
Unlock for access to all 114 flashcards in this deck.
Unlock Deck
k this deck
64
Let 1 stand for "any given period" and 2 stand for "base period". The formula of any index number can be written as:
Unlock Deck
Unlock for access to all 114 flashcards in this deck.
Unlock Deck
k this deck
65
Which of the following is a positive statement?
A) The higher the price for gasoline, the less of it will be consumed.
B) Corporations in Canada should pay more taxes.
C) Canada should reduce its imports of consumer goods.
D) Substitutes for fossil fuels should be developed.
E) There should be one price for gasoline throughout Canada.
A) The higher the price for gasoline, the less of it will be consumed.
B) Corporations in Canada should pay more taxes.
C) Canada should reduce its imports of consumer goods.
D) Substitutes for fossil fuels should be developed.
E) There should be one price for gasoline throughout Canada.
Unlock Deck
Unlock for access to all 114 flashcards in this deck.
Unlock Deck
k this deck
66
In a co- ordinate graph, with Y on the vertical axis and X on the horizontal axis, the variable X is positive and the variable Y is negative in the quadrant.
A) bottom, left
B) top, right
C) bottom, right
D) top, left
A) bottom, left
B) top, right
C) bottom, right
D) top, left
Unlock Deck
Unlock for access to all 114 flashcards in this deck.
Unlock Deck
k this deck
67
The table below shows hypothetical tuition costs at a Canadian university.
-Refer to Table 2- 1. Assume that 2005 is used as the base year, with the index number = 100. The value of the index number in 2009 is
A) 96
B) 1.04
C) 0.96
D) 100
E) 104
-Refer to Table 2- 1. Assume that 2005 is used as the base year, with the index number = 100. The value of the index number in 2009 is
A) 96
B) 1.04
C) 0.96
D) 100
E) 104
Unlock Deck
Unlock for access to all 114 flashcards in this deck.
Unlock Deck
k this deck
68
FIGURE 2- 2Refer to Figure 2- 2. The slope of curve A is
A) negative and constant.
B) positive and constant.
C) undefined.
D) negative and changing.
E) positive and changing.
Unlock Deck
Unlock for access to all 114 flashcards in this deck.
Unlock Deck
k this deck
69
When an increase in one variable is associated with an increase in a second variable, the two variables are
A) inversely proportionally related.
B) equivalent.
C) proportionally related.
D) positively related.
E) negatively related.
A) inversely proportionally related.
B) equivalent.
C) proportionally related.
D) positively related.
E) negatively related.
Unlock Deck
Unlock for access to all 114 flashcards in this deck.
Unlock Deck
k this deck
70
When it is said that variable A depends on variable B, then A is
A) a function of B.
B) independent of B.
C) proportional to B.
D) a derivative of B.
E) partially exclusive of B.
A) a function of B.
B) independent of B.
C) proportional to B.
D) a derivative of B.
E) partially exclusive of B.
Unlock Deck
Unlock for access to all 114 flashcards in this deck.
Unlock Deck
k this deck
71
Suppose point A represents coordinates (X = 5, Y = 6) and point B represents coordinates (X = 2, Y
= 3). Then the slope of the straight line joining points A and B is
A) - 1.
B) 2/3.
C) 5/6.
D) 1.
E) 3/2.
= 3). Then the slope of the straight line joining points A and B is
A) - 1.
B) 2/3.
C) 5/6.
D) 1.
E) 3/2.
Unlock Deck
Unlock for access to all 114 flashcards in this deck.
Unlock Deck
k this deck
72
Suppose we have data for 1000 students for a period of one year. The data show that those students who spend more hours studying have a higher grade point average (GPA). We can say that
A) there is a positive correlation between hours of study time and GPA.
B) more hours spent studying leads to a higher GPA.
C) if hours of study time increase, then GPA will automatically increase.
D) there is a causal relationship between hours of study time and GPA.
E) having a higher GPA leads students to spend more time studying.
Unlock Deck
Unlock for access to all 114 flashcards in this deck.
Unlock Deck
k this deck
73
Suppose point A represents co- ordinates (X=10, Y=12) and point B represents co- ordinates (X=5, Y=7). The slope of the straight line joining points A and B is
A) 2/3.
B) - 1.
C) 3/2.
D) 1.
E) 5/6.
A) 2/3.
B) - 1.
C) 3/2.
D) 1.
E) 5/6.
Unlock Deck
Unlock for access to all 114 flashcards in this deck.
Unlock Deck
k this deck
74
The statement "Y is a function of X" means that the
A) values of Y and X are independent.
B) values of Y and X are the same.
C) values of Y and X are related to some third variable.
D) value of Y depends on that of X.
E) value of X depends on that of Y.
A) values of Y and X are independent.
B) values of Y and X are the same.
C) values of Y and X are related to some third variable.
D) value of Y depends on that of X.
E) value of X depends on that of Y.
Unlock Deck
Unlock for access to all 114 flashcards in this deck.
Unlock Deck
k this deck
75
FIGURE 2- 2Refer to Figure 2- 2. The slope of curve B is
A) undefined.
B) negative and changing.
C) negative and constant.
D) positive and changing.
E) positive and constant.
Unlock Deck
Unlock for access to all 114 flashcards in this deck.
Unlock Deck
k this deck
76
Economics is scientific because
A) economists can conduct controlled experiments.
B) it tests hypotheses by appealing to evidence.
C) economists use data.
D) individual behaviour is predictable.
E) economists can conduct laboratory experiments.
A) economists can conduct controlled experiments.
B) it tests hypotheses by appealing to evidence.
C) economists use data.
D) individual behaviour is predictable.
E) economists can conduct laboratory experiments.
Unlock Deck
Unlock for access to all 114 flashcards in this deck.
Unlock Deck
k this deck
77
The table below shows hypothetical per- minute cell phone charges for "pay- and- talk" service over several years.
-Refer to Table 2- 2. Assume that 2005 is used as the base year, with the index number = 100. The value of the index number in 2007 is
A) 1.375
B) 137.5
C) 0.72
D) 72.73
E) 100
-Refer to Table 2- 2. Assume that 2005 is used as the base year, with the index number = 100. The value of the index number in 2007 is
A) 1.375
B) 137.5
C) 0.72
D) 72.73
E) 100
Unlock Deck
Unlock for access to all 114 flashcards in this deck.
Unlock Deck
k this deck
78
An economist has data showing Canadian GDP for the years 1945- 2009. The best way to illustrate these data is
A) a logarithmic scale diagram.
B) a cross- sectional bar- chart graph.
C) a time- series line graph.
D) a scatter diagram.
E) a time- series pie chart.
A) a logarithmic scale diagram.
B) a cross- sectional bar- chart graph.
C) a time- series line graph.
D) a scatter diagram.
E) a time- series pie chart.
Unlock Deck
Unlock for access to all 114 flashcards in this deck.
Unlock Deck
k this deck
79
If a theory's prediction is tested and rejected,
A) it is rejected with certainty, because it is not possible to reject a hypothesis that is actually true.
B) a new hypothesis is usually suggested and tested.
C) the statistical tolerance of risk for accepting a false hypothesis should be increased.
D) inquiry into the matter should cease.
E) the original data and assumptions should be discarded.
Unlock Deck
Unlock for access to all 114 flashcards in this deck.
Unlock Deck
k this deck
80
Negatively related variables change such that as the value of one variable
A) increases, the value of the other decreases.
B) decreases, the value of the other variable decreases.
C) decreases, the value of the other variable remains the same.
D) increases, the value of the other variable remains the same.
E) increases, the value of the other variable increases.
A) increases, the value of the other decreases.
B) decreases, the value of the other variable decreases.
C) decreases, the value of the other variable remains the same.
D) increases, the value of the other variable remains the same.
E) increases, the value of the other variable increases.
Unlock Deck
Unlock for access to all 114 flashcards in this deck.
Unlock Deck
k this deck
Unlock Deck
Unlock for access to all 114 flashcards in this deck.


