Exam 2: Economic Theories, Data, and Graphs
Exam 1: Economic Issues and Concepts107 Questions
Exam 2: Economic Theories, Data, and Graphs114 Questions
Exam 3: Demand, Supply, and Price134 Questions
Exam 4: Elasticity124 Questions
Exam 5: Markets in Action114 Questions
Exam 6: Consumer Behaviour119 Questions
Exam 7: Producers in the Short Run120 Questions
Exam 8: Producers in the Long Run110 Questions
Exam 9: Competitive Markets125 Questions
Exam 10: Monopoly, Cartels, and Price Discrimination110 Questions
Exam 11: Imperfect Competition110 Questions
Exam 12: Economic Efficiency and Public Policy109 Questions
Exam 13: How Factor Markets Work123 Questions
Exam 14: Labour Markets92 Questions
Exam 15: Interest Rates and the Capital Market90 Questions
Exam 16: Market Failures and Government Intervention110 Questions
Exam 17: The Economics of Environmental Protection110 Questions
Exam 18: Taxation and Public Expenditure110 Questions
Exam 33: The Gains From International Trade112 Questions
Exam 34: Trade Policy114 Questions
Select questions type
Suppose that a particular theory predicts that on Monday, Wednesday, and Friday the stock market will rise and that on Tuesday and Thursday the stock market will fall. If an economist tests this theory and finds that over a six- month period the theory predicts accurately, the economist would likely say that the theory
Free
(Multiple Choice)
4.9/5  (36)
(36)
Correct Answer: Verified
B
The base year for an index number is
Free
(Multiple Choice)
4.9/5 (35)
Correct Answer:Verified
B
The table below shows hypothetical per- minute cell phone charges for "pay- and- talk" service over several years. 2005 0.55 2006 0.50 2007 0.40 2008 0.35 2009 0.25 TABLE 2- 2
-Refer to Table 2- 2. Assume that 2005 is used as the base year, with the index number = 100. What is the percentage change in the per- minute charge from 2008 to 2009?
(Multiple Choice)
4.7/5 (31)
Choose the statement that best describes how endogenous variables differ from exogenous variables.
(Multiple Choice)
4.9/5 (32)
When it is said that variable A depends on variable B, then A is
(Multiple Choice)
4.9/5 (35)
At the minimum or the maximum of the graph of a non- linear function (with x on the horizontal axis and y on the vertical axis) the slope of the curve is
(Multiple Choice)
4.9/5 (33)
Most economists believe that economics be made completely value- free, in part because it is to absolutely refute a theory on the basis of factual evidence.
(Multiple Choice)
4.9/5 (37)
Suppose a theory predicts that lowering tuition fees at Canadian universities will increase enrollment from low- income households. If empirical evidence consistently rejects this prediction, then we
(Multiple Choice)
4.9/5 (31)
The statement that a country's rate of economic growth is influenced by its firms' investment behaviour is an example of a(n)
(Multiple Choice)
4.8/5 (31)
Choose the answer that best explains why economists build models that abstract from the complexities of reality.
(Multiple Choice)
4.9/5 (42)
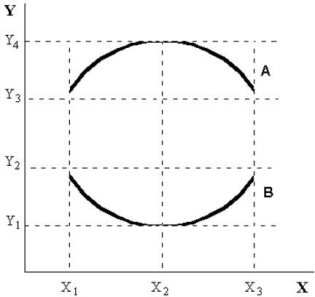 FIGURE 2- 3
-Refer to Figure 2- 3. On curve A, the maximum value of Y occurs at
FIGURE 2- 3
-Refer to Figure 2- 3. On curve A, the maximum value of Y occurs at
(Multiple Choice)
4.9/5 (42)
The mathematical expression of a relationship between two or more variables is usually known as
(Multiple Choice)
4.8/5 (30)
The table below shows hypothetical tuition costs at a Canadian university. Year Tuition 2005 \ 5000 2006 \ 5050 2007 \ 5100 2008 \ 5150 2009 \ 5200 TABLE 2- 1
-Refer to Table 2- 1. The increase in tuition from 2005 to 2009 is:
(Multiple Choice)
4.9/5 (32)
Filters
- Essay(0)
- Multiple Choice(0)
- Short Answer(0)
- True False(0)
- Matching(0)