Deck 3: Measuring and Using Demand
Full screen (f)
Question
Question
Question
Question
Question
Question
Question
Question
Question
Question
Question
Question
Question
Question
Question
Question
Question
Question
Question
Question
Question
Question
Question
Question
Question
Question
 The table above shows a sample of actual data used to estimate the demand function for Happy Clams seafood dinners.
Refer to the table above. Excel estimates the demand function for Happy Clams seafood dinners to be: Qd = 1,200 - (20.50 × P). Which of the following statements is true?
A)When the price is equal to $18, the actual quantity sold exceeds the predicted quantity sold.
B)When the price is equal to $18, the estimated residual is zero.
C)When the price is equal to $18, the predicted quantity sold exceeds the actual quantity sold.
D)When the price is equal to $18, the actual quantity sold equals the predicted quantity sold.
Question
Question
Question
The table above shows a sample of actual data used to estimate the demand function for Happy Clams seafood dinners.Refer to the table above. Excel estimates the demand function for Happy Clams seafood dinners to be: Qd = 1,200 - (20.50 × P). Which of the following statements is true?
A)When the price is equal to $16, the estimated residual is - 8.0.
B)When the price is equal to $16, the estimated residual is 8.0.
C)When the price is equal to $16, the estimated residual is - 28.0.
D)When the price is equal to $16, the estimated residual is 28.0.
Question
The table above shows a sample of actual data used to estimate the demand function for Happy Clams seafood dinners.Refer to the table above. Excel estimates the demand function for Happy Clams seafood dinners to be: Qd = 1,200 - (20.50 × P). Which of the following statements is true?
A)When the price is equal to $25, the estimated residual is 0.
B)When the price is equal to $25, the estimated residual is - 1.50.
C)When the price is equal to $25, the estimated residual is 1.50.
D)When the price is equal to $25, the predicted quantity of dinners sold exceeds the predicted quantity of dinners sold.
Question
Question
Question
Question
The table above shows a sample of actual data used to estimate the demand function for Happy Clams seafood dinners.Refer to the table above. Excel estimates the demand function for Happy Clams seafood dinners to be: Qd = 1,200 - (20.50 × P). Which of the following statements is true?
A)When the price is equal to $22, the actual quantity sold exceeds the predicted quantity sold.
B)When the price is equal to $22, the actual quantity sold equals the predicted quantity sold.
C)When the price is equal to $22, the estimated residual is zero.
D)When the price is equal to $22, the predicted quantity sold exceeds the actual quantity sold.
Question
Question
Question
Question
Question
Question
The table above shows a sample of actual data used to estimate the demand function for Happy Clams seafood dinners.Refer to the table above. Excel estimates the demand function for Happy Clams seafood dinners to be: Qd = 1,200 - (20.50 × P). Which of the following statements is true?
A)When the price is equal to $20, the estimated residual is - 10.0.
B)When the price is equal to $20, the estimated residual is - 5.0.
C)When the price is equal to $20, the estimated residual is 5.0.
D)When the price is equal to $20, the estimated residual is 10.0.
Question
Question
Question
Question
Question
Question
Question
Question
Question
Question
Question
Question
Question
Question
Question
Question
Question
Question
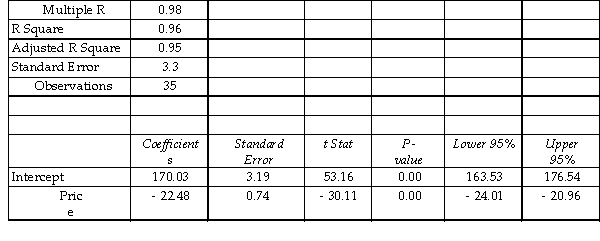 Using Excel, the manager of Quick Breaks Coffees has estimated the daily demand function for its regular coffees; the results are shown in the table above. Which of the following statements is correct?
A)The 99 percent critical value exceeds the t- statistic for the estimated slope coefficient.
B)The manager can be 99 percent confident that the price of coffees affects the quantity demanded.
C)The manager can be 99 percent confident that the true slope coefficient for price is equal to zero.
D)The 95 percent critical value exceeds the t- statistic for the estimated slope coefficient.
Question
Question
Question
Question
Question
Question
Question
Question
Question
Question
Question
Question
Question
Question
Question
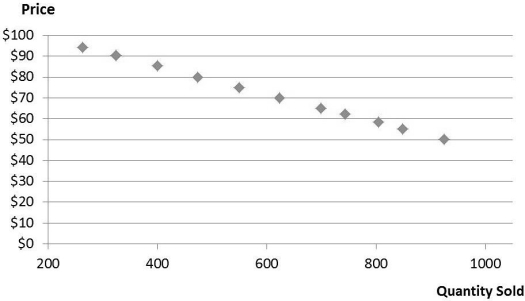 The scatter diagram above shows the actual data for the price and quantity demanded of a product.
Refer to the scatter diagram above. The diagram suggests which of the following?
A)The true demand is likely to be linear it the natural logarithms.
B)The estimated demand curve will have a positive slope.
C)A straight- line demand curve will likely be the best fit.
D)A nonlinear demand curve will likely be the best fit.
Question
Question
The scatter diagram above shows the actual data for the price and quantity demanded of a product.Refer to the scatter diagram above. The scatter diagram suggests all of the following, except which one?
A)The R2 is likely to be greater when an nonlinear demand curve is estimated compared to a straight- line demand curve.
B)The estimated demand will have a negative slope.
C)A straight- line demand curve is likely to be a better fit to the actual data compared to a nonlinear demand curve.
D)The R2 is likely to be greater when a straight- line demand curve is estimated compared to a nonlinear demand curve.
Question
Question
Question
Question
Question

Unlock Deck
Sign up to unlock the cards in this deck!
Unlock Deck
Unlock Deck
1/124
Play
Full screen (f)
Deck 3: Measuring and Using Demand
1
Big Poppa's BBQ Sandwiches is a local restaurant specializing in BBQ sandwiches. Using Excel, Big Poppa's estimates the weekly demand function for its BBQ sandwiches to be Qd = 1,576.55 - (25.50 × P). If Big Poppa's charges $15 per sandwich, the predicted quantity of sandwiches sold is
.
A)1,576.55
B)1,090.05
C)1,194.05
D)1,551.05
.
A)1,576.55
B)1,090.05
C)1,194.05
D)1,551.05
C
2
Because there will always be some random factors of demand that we cannot capture, which of the following is added to the regression equation?
A)an intercept
B)consumers' incomes
C)the price of the good
D)a random error term
A)an intercept
B)consumers' incomes
C)the price of the good
D)a random error term
D
3
Big City Java is a local coffee bar. Using Excel, the manager of Big City Java estimates the weekly demand function for their grand mocha coffees to be Qd = 650 - (15.25 × P). The estimated regression equation suggests which of the following is true?
A)The Law of Demand does not hold for Big City Java's grand mochas.
B)If a price of $10 is charged, the predicted weekly demand of grand mocha coffees is 639.75.
C)If a price of $5 is charged, the predicted weekly demand of grand mocha coffees is 573.75.
D)The horizontal intercept of the demand equation is 15.25.
C
4
Big Poppa's BBQ Sandwiches is a local restaurant specializing in BBQ sandwiches. Using Excel, Big Poppa's estimates the weekly demand function for its BBQ sandwiches to be Qd = 1,576.55 - (25.50 × P). The estimated regression equation suggests which of the following is true?
A)As the price of Big Poppa's BBQ sandwiches increases, the quantity demanded also increases.
B)There is a negative relationship between the price of Big Poppa's BBQ sandwiches and the quantity demanded.
C)The Law of Demand does not hold for Big Poppa's BBQ Sandwiches.
D)If Big Poppa's increased its price by $1, the quantity demanded would increase by 25.50.
Unlock Deck
Unlock for access to all 124 flashcards in this deck.
Unlock Deck
k this deck
5
Big Poppa's BBQ Sandwiches is a local restaurant specializing in BBQ sandwiches. Using Excel, Big Poppa's estimates the weekly demand function for its BBQ sandwiches to be Qd = 1,576.55 - (25.50 × P). The estimated regression equation suggests which of the following is true?
A)The intercept of the demand equation is - 25.50.
B)If a price of $5 a sandwich is charged, the predicted quantity of sandwiches demanded is 1,449.05.
C)The intercept of the demand equation is 25.50.
D)If a price of $10 a sandwich is charged, the predicted quantity of sandwiches demanded is 1,576.55.
Unlock Deck
Unlock for access to all 124 flashcards in this deck.
Unlock Deck
k this deck
6
Big Poppa's BBQ Sandwiches is a local restaurant specializing in BBQ sandwiches. Using Excel, Big Poppa's estimates the weekly demand function for its BBQ sandwiches to be Qd = 1,576.55 - (25.50 × P). If Big Poppa's charges $8 per sandwich, the predicted quantity of sandwiches sold is
.
A)1,576.55
B)1,225.76
C)1,551.05
D)1,372.55
.
A)1,576.55
B)1,225.76
C)1,551.05
D)1,372.55
Unlock Deck
Unlock for access to all 124 flashcards in this deck.
Unlock Deck
k this deck
7
Big City Java is a local coffee bar. Using Excel, the manager of Big City Java estimates the weekly demand function for their grand mocha coffees to be Qd = 650 - (15.25 × P). The estimated regression equation suggests which of the following is true?
A)The price of grand mocha coffees represents the dependent variable in the regression equation.
B)If a price of $5 is charged, the predicted weekly demand of grand mocha coffees is 453.75.
C)There is a positive relationship between the price of grand mocha coffees and the quantity demanded.
D)As the price of grand mocha coffees increases, the quantity demanded decreases.
Unlock Deck
Unlock for access to all 124 flashcards in this deck.
Unlock Deck
k this deck
8
Big City Java is a local coffee bar. Using Excel, the manager of Big City Java estimates the weekly demand function for their grand mocha coffees to be Qd = 650 - (15.25 × P). The estimated regression equation suggests that if Big City Java decreased its price of grana mocha coffees from $7.50 to $6.50, the predicted quantity demanded of coffees would .
A)decrease by 15.25
B)increase by 15.25
C)not change
D)exactly double
A)decrease by 15.25
B)increase by 15.25
C)not change
D)exactly double
Unlock Deck
Unlock for access to all 124 flashcards in this deck.
Unlock Deck
k this deck
9
A regression analysis estimated using Ordinary Least Squares (OLS)does all of the following except which one?
A)minimize the sum of the squared differences between the actual and predicted quantities
B)estimates the relationship between a dependent variable and one or more independent variables
C)minimizes the sum of the squared residuals
D)estimates a regression equation that has zero residuals
A)minimize the sum of the squared differences between the actual and predicted quantities
B)estimates the relationship between a dependent variable and one or more independent variables
C)minimizes the sum of the squared residuals
D)estimates a regression equation that has zero residuals
Unlock Deck
Unlock for access to all 124 flashcards in this deck.
Unlock Deck
k this deck
10
In a regression analysis that estimates a demand function, the dependent variable is the .
A)consumers' income
B)quantity demanded
C)prices of related goods
D)price of the good
A)consumers' income
B)quantity demanded
C)prices of related goods
D)price of the good
Unlock Deck
Unlock for access to all 124 flashcards in this deck.
Unlock Deck
k this deck
11
Big City Java is a local coffee bar. Using Excel, the manager of Big City Java estimates the weekly demand function for their grand mocha coffees to be Qd = 650 - (15.25 × P). The estimated regression equation suggests that if Big City Java decreased its price of grana mocha coffees from $7 to $5, the predicted quantity demanded of coffees would _.
A)decrease by half
B)decrease
C)not change
D)increase
A)decrease by half
B)decrease
C)not change
D)increase
Unlock Deck
Unlock for access to all 124 flashcards in this deck.
Unlock Deck
k this deck
12
All of the following are true of the error term in a regression equation except which one?
A)It's distribution is assumed to be bell- shaped.
B)It is random.
C)It is assumed to be normally distributed.
D)It is constant.
A)It's distribution is assumed to be bell- shaped.
B)It is random.
C)It is assumed to be normally distributed.
D)It is constant.
Unlock Deck
Unlock for access to all 124 flashcards in this deck.
Unlock Deck
k this deck
13
Using Excel, Tough Scrubbers estimates the quarterly demand for their kitchen sponges to be Qd = 5,600 - (25 × P). If the actual demand for their kitchen sponges is 5,563 when a price of $3 per sponge is charge, what is the estimated residual?
A)38
B)0
C)12
D)25
A)38
B)0
C)12
D)25
Unlock Deck
Unlock for access to all 124 flashcards in this deck.
Unlock Deck
k this deck
14
Using Excel, Tough Scrubbers estimates the quarterly demand for their kitchen sponges to be Qd = 5,600 - (25 × P). If the actual demand for their kitchen sponges is 5,600 when a price of $1 per sponge is charge, what is the estimated residual?
A)- 25
B)- 50
C)0
D)25
A)- 25
B)- 50
C)0
D)25
Unlock Deck
Unlock for access to all 124 flashcards in this deck.
Unlock Deck
k this deck
15
Using Excel, Tough Scrubbers estimates the quarterly demand for their kitchen sponges to be Qd = 5,600 - (25 × P). If the actual demand for their kitchen sponges is 5,400 when a price of $5 per sponge is charge, what is the estimated residual?
A)- 75
B)75
C)0
D)- 55
A)- 75
B)75
C)0
D)- 55
Unlock Deck
Unlock for access to all 124 flashcards in this deck.
Unlock Deck
k this deck
16
Using Excel, Tough Scrubbers estimates the quarterly demand for their kitchen sponges to be Qd = 5,600 - (25 × P). If the actual demand for their kitchen sponges is 5,535 when a price of $4 per sponge is charge, what is the estimated residual?
A)60
B)18
C)0
D)35
A)60
B)18
C)0
D)35
Unlock Deck
Unlock for access to all 124 flashcards in this deck.
Unlock Deck
k this deck
17
Big City Java is a local coffee bar. Using Excel, the manager of Big City Java estimates the weekly demand function for their grand mocha coffees to be Qd = 650 - (15.25 × P). The estimated regression equation suggests that if Big City Java decreased its price of grana mocha coffees from $7.50 to $5.50, the predicted quantity demanded of coffees would .
A)decrease by 30.5
B)exactly double
C)not change
D)increase by 30.5
A)decrease by 30.5
B)exactly double
C)not change
D)increase by 30.5
Unlock Deck
Unlock for access to all 124 flashcards in this deck.
Unlock Deck
k this deck
18
Big City Java is a local coffee bar. Using Excel, the manager of Big City Java estimates the weekly demand function for their grand mocha coffees to be Qd = 650 - (15.25 × P). The estimated regression equation suggests that if Big City Java increased its price of grand mocha coffees from $6 to $8, the predicted quantity demanded of coffees would _.
A)increase
B)decrease
C)not change
D)exactly double
A)increase
B)decrease
C)not change
D)exactly double
Unlock Deck
Unlock for access to all 124 flashcards in this deck.
Unlock Deck
k this deck
19
Because there will always be some random factors the affect demand that cannot be captured, a is added to the regression equation.
A)dependent variable
B)horizontal intercept
C)random error term
D)slope coefficient
A)dependent variable
B)horizontal intercept
C)random error term
D)slope coefficient
Unlock Deck
Unlock for access to all 124 flashcards in this deck.
Unlock Deck
k this deck
20
A regression analysis estimated using Ordinary Least Squares (OLS)does all of the following except which one?
A)estimates the relationship between a dependent variable and one or more independent variables
B)minimizes the sum of the squared residuals
C)fits a perfect straight line that connects each of the scatter points
D)includes a random error term
A)estimates the relationship between a dependent variable and one or more independent variables
B)minimizes the sum of the squared residuals
C)fits a perfect straight line that connects each of the scatter points
D)includes a random error term
Unlock Deck
Unlock for access to all 124 flashcards in this deck.
Unlock Deck
k this deck
21
The first step in interpreting the results from a regression is _ .
A)reestimating the regression with new data
B)measuring how confident you are that the estimated coefficients are close to the true coefficients
C)using the estimated demand to predict the quantity demanded at various prices
D)using the estimated demand to predict the price at various values of the quantity demanded
Unlock Deck
Unlock for access to all 124 flashcards in this deck.
Unlock Deck
k this deck
22
All of the following are true regarding the standard error of a coefficient except which one?
A)A small standard error suggests that the estimated coefficient is likely to be close to the true value.
B)A large standard error suggests that the estimated coefficient is likely to be close to the true value.
C)The standard error reflects the fact that the estimated coefficients have random element.
D)The standard error of a coefficient measures how much the estimated coefficient is likely to change if another set of data is used to reestimate the regression.
Unlock Deck
Unlock for access to all 124 flashcards in this deck.
Unlock Deck
k this deck
23
Using Excel, Big Poppa's estimates the weekly demand function for its BBQ sandwiches to be Qd = 1,568.23 - (18.67 × P). In reference to the estimated slope coefficient for price b^, which of the following standard errors will provide the largest 95 percent confidence interval for the slope coefficient?
A)1.27
B)2.67
C)2.50
D)2.12
A)1.27
B)2.67
C)2.50
D)2.12
Unlock Deck
Unlock for access to all 124 flashcards in this deck.
Unlock Deck
k this deck
24
Using Excel, Big Poppa's estimates the weekly demand function for its BBQ sandwiches to be Qd = 1,258.33 - (19.55 × P). In reference to the estimated slope coefficient for price b^, which of the following standard errors will provide the smallest 95 percent confidence interval for the slope coefficient?
A)3
B)1.25
C)0.50
D)0.95
A)3
B)1.25
C)0.50
D)0.95
Unlock Deck
Unlock for access to all 124 flashcards in this deck.
Unlock Deck
k this deck
25
Using Excel, Big Poppa's estimates the weekly demand function for its BBQ sandwiches to be Qd = 1,423.50 - (28.67 × P). In reference to the estimated slope coefficient for price b^, which of the following standard errors will provide the smallest 95 percent confidence interval for the slope coefficient?
A)1.95
B)1.05
C)1.29
D)1.98
A)1.95
B)1.05
C)1.29
D)1.98
Unlock Deck
Unlock for access to all 124 flashcards in this deck.
Unlock Deck
k this deck
26
The table above shows a sample of actual data used to estimate the demand function for Happy Clams seafood dinners.Refer to the table above. Excel estimates the demand function for Happy Clams seafood dinners to be: Qd = 1,200 - (20.50 × P). Which of the following statements is true?
A)When the price is equal to $18, the actual quantity sold exceeds the predicted quantity sold.
B)When the price is equal to $18, the estimated residual is zero.
C)When the price is equal to $18, the predicted quantity sold exceeds the actual quantity sold.
D)When the price is equal to $18, the actual quantity sold equals the predicted quantity sold.
Unlock Deck
Unlock for access to all 124 flashcards in this deck.
Unlock Deck
k this deck
27
Using Excel, Big Poppa's estimates the weekly demand function for its BBQ sandwiches to be Qd = 1,385.63 - (22.30 × P). In reference to the estimated slope coefficient for price b^, which of the following standard errors will provide the widest 95 percent confidence interval for the slope coefficient?
A)4.75
B)1.15
C)1.87
D)3.25
A)4.75
B)1.15
C)1.87
D)3.25
Unlock Deck
Unlock for access to all 124 flashcards in this deck.
Unlock Deck
k this deck
28
Using Excel, Big Poppa's estimates the weekly demand function for its BBQ sandwiches to be Qd = 1,385.63 - (22.30 × P). In reference to the estimated slope coefficient for price b^, which of the following standard errors gives you the most confidence that the estimated slope coefficient is close to the true slope coefficient?
A)22.0
B)- 22.0
C)1.12
D)2.15
A)22.0
B)- 22.0
C)1.12
D)2.15
Unlock Deck
Unlock for access to all 124 flashcards in this deck.
Unlock Deck
k this deck
29
The table above shows a sample of actual data used to estimate the demand function for Happy Clams seafood dinners.Refer to the table above. Excel estimates the demand function for Happy Clams seafood dinners to be: Qd = 1,200 - (20.50 × P). Which of the following statements is true?
A)When the price is equal to $16, the estimated residual is - 8.0.
B)When the price is equal to $16, the estimated residual is 8.0.
C)When the price is equal to $16, the estimated residual is - 28.0.
D)When the price is equal to $16, the estimated residual is 28.0.
Unlock Deck
Unlock for access to all 124 flashcards in this deck.
Unlock Deck
k this deck
30
The table above shows a sample of actual data used to estimate the demand function for Happy Clams seafood dinners.Refer to the table above. Excel estimates the demand function for Happy Clams seafood dinners to be: Qd = 1,200 - (20.50 × P). Which of the following statements is true?
A)When the price is equal to $25, the estimated residual is 0.
B)When the price is equal to $25, the estimated residual is - 1.50.
C)When the price is equal to $25, the estimated residual is 1.50.
D)When the price is equal to $25, the predicted quantity of dinners sold exceeds the predicted quantity of dinners sold.
Unlock Deck
Unlock for access to all 124 flashcards in this deck.
Unlock Deck
k this deck
31
If Excel estimates the demand function for a product to be: Qd = 1,500 - (5 × P)and the actual quantity demanded is 850 when a price of $125 is charged, the estimated residual is 25.
Unlock Deck
Unlock for access to all 124 flashcards in this deck.
Unlock Deck
k this deck
32
Using Excel, Big Poppa's estimates the weekly demand function for its BBQ sandwiches to be Qd = 1,576.55 - (25.50 × P). In reference to the estimated slope coefficient for price b^, which of the following standard errors gives you the most confidence that the estimated slope coefficient is close to the true slope coefficient?
A)2.57
B)25.2
C)- 25.2
D)1.03
A)2.57
B)25.2
C)- 25.2
D)1.03
Unlock Deck
Unlock for access to all 124 flashcards in this deck.
Unlock Deck
k this deck
33
If Excel estimated the 95 percent confidence interval for a slope coefficient for the price b^ to run from - 2.73 to - 1.67, which of the following is true?
A)You are 95 percent confident that the true slope coefficient is greater than - 2.73.
B)You are 95 percent confident that the true slope coefficient is greater than - 1.67.
C)You are 95 percent confident that the true slope coefficient falls within the range - 2.73 to - 1.67.
D)You are 99 percent confident that the true slope coefficient falls within the range - 2.73 to - 1.67.
Unlock Deck
Unlock for access to all 124 flashcards in this deck.
Unlock Deck
k this deck
34
The table above shows a sample of actual data used to estimate the demand function for Happy Clams seafood dinners.Refer to the table above. Excel estimates the demand function for Happy Clams seafood dinners to be: Qd = 1,200 - (20.50 × P). Which of the following statements is true?
A)When the price is equal to $22, the actual quantity sold exceeds the predicted quantity sold.
B)When the price is equal to $22, the actual quantity sold equals the predicted quantity sold.
C)When the price is equal to $22, the estimated residual is zero.
D)When the price is equal to $22, the predicted quantity sold exceeds the actual quantity sold.
Unlock Deck
Unlock for access to all 124 flashcards in this deck.
Unlock Deck
k this deck
35
If Excel estimates the demand function for a product to be: Qd = 1,500 - (5 × P)and a price of $125 is charged, the predicted quantity demanded for the product is 875.
Unlock Deck
Unlock for access to all 124 flashcards in this deck.
Unlock Deck
k this deck
36
The goal of regression analysis is to make the residuals as small as possible.
Unlock Deck
Unlock for access to all 124 flashcards in this deck.
Unlock Deck
k this deck
37
When managers use Ordinary Least Squares to estimate a regression equation, the estimated regression equation is as close to the actual data values as possible.
Unlock Deck
Unlock for access to all 124 flashcards in this deck.
Unlock Deck
k this deck
38
If Excel estimates the demand function for a product to be: Qd = 1,500 - (5 × P), the estimated regression equation indicates that the Law of Demand does not hold.
Unlock Deck
Unlock for access to all 124 flashcards in this deck.
Unlock Deck
k this deck
39
All of the following are true regarding the standard error of a coefficient except which one?
A)The standard error reflects the fact that the estimated coefficients have random element.
B)The standard error requires regression equations to be reestimated.
C)The standard error of a coefficient measures how much the estimated coefficient is likely to change if another set of data is used to reestimate the regression.
D)A small standard error suggests that the estimated coefficient is likely to be close to the true value.
Unlock Deck
Unlock for access to all 124 flashcards in this deck.
Unlock Deck
k this deck
40
The table above shows a sample of actual data used to estimate the demand function for Happy Clams seafood dinners.Refer to the table above. Excel estimates the demand function for Happy Clams seafood dinners to be: Qd = 1,200 - (20.50 × P). Which of the following statements is true?
A)When the price is equal to $20, the estimated residual is - 10.0.
B)When the price is equal to $20, the estimated residual is - 5.0.
C)When the price is equal to $20, the estimated residual is 5.0.
D)When the price is equal to $20, the estimated residual is 10.0.
Unlock Deck
Unlock for access to all 124 flashcards in this deck.
Unlock Deck
k this deck
41
For a given slope coefficient, a 95 percent confidence interval will be larger than a 99 percent confidence interval.
Unlock Deck
Unlock for access to all 124 flashcards in this deck.
Unlock Deck
k this deck
42
Using Excel, the manager of Quick Breaks Coffees has estimated the daily demand function for its regular coffees; the results are shown in the table above. Which of the following statements is correct?
A)The predicted values from the regression account for 95 percent of the variation in the actual data.
B)The predicted values from the regression account for 98 percent of the variation in the actual data.
C)The estimated regression has a very poor fit to the data.
D)The predicted values lie far from the actual values.
Unlock Deck
Unlock for access to all 124 flashcards in this deck.
Unlock Deck
k this deck
43
If the R2 is large, you are confident in the regression results because the predicted values are _ the actual values.
A)more; far from
B)less; close to
C)more; close to
D)less; far from
A)more; far from
B)less; close to
C)more; close to
D)less; far from
Unlock Deck
Unlock for access to all 124 flashcards in this deck.
Unlock Deck
k this deck
44
Using Excel, the manager of Quick Breaks Coffees has estimated the daily demand function for its regular coffees; the results are shown in the table above. Which of the following statements is correct?
A)The manager can be 95 percent confident that the true slope coefficient for price is positive.
B)The manager can be 95 percent confident that the true slope coefficient for price lies between - 24.01 and - 20.96.
C)The manager can be 95 percent confident that the true slope coefficient for price is greater than - 24.01.
D)The manager can be 95 percent confident that the true slope coefficient for price is equal to zero.
Unlock Deck
Unlock for access to all 124 flashcards in this deck.
Unlock Deck
k this deck
45
If Excel estimated the 95 percent confidence interval for a slope coefficient for the price b^ to run from - 5.50 to - 2.30, it is not possible for the true slope coefficient to be equal to - 5.75.
Unlock Deck
Unlock for access to all 124 flashcards in this deck.
Unlock Deck
k this deck
46
An hypothesis test using 99 percent confidence has a significance level equal to .
A)0.05
B)0.01
C)0.99
D)1
A)0.05
B)0.01
C)0.99
D)1
Unlock Deck
Unlock for access to all 124 flashcards in this deck.
Unlock Deck
k this deck
47
Using Excel, the manager of Quick Breaks Coffees has estimated the daily demand function for its regular coffees; the results are shown in the table above. If a price of $5 is charged for the coffees, the predicted quantity demanded is _.
A)170.03
B)86.23
C)57.63
D)147.55
A)170.03
B)86.23
C)57.63
D)147.55
Unlock Deck
Unlock for access to all 124 flashcards in this deck.
Unlock Deck
k this deck
48
If Excel estimated the 95 percent confidence interval for a slope coefficient for the price b^ to run from - 15.50 to - 12.30, which of the following is true?
A)You are 95 percent confident that in response to dollar increase in price, consumers will decrease the quantity demanded by an amount greater than 12.30.
B)You are 95 percent confident that in response to dollar increase in price, consumers will increase the quantity demanded by an amount that lies between 12.30 and 15.50.
C)You are 95 percent confident that in response to dollar increase in price, consumers will decrease the quantity demanded by an amount that lies between 12.30 and 15.50.
D)You are 95 percent confident that in response to dollar increase in price, consumers will decrease the quantity demanded by an amount less than 15.50.
Unlock Deck
Unlock for access to all 124 flashcards in this deck.
Unlock Deck
k this deck
49
If the P- value for an estimated slope coefficient is 0.025, using 95 percent confidence, which of the following is true?
A)Reject the alternative hypothesis that the true value of the slope coefficient equals zero.
B)Fail to reject the null hypothesis that the true value of the slope coefficient equals zero.
C)Fail to reject the alternative hypothesis that the true value of the slope coefficient equals zero.
D)Reject the null hypothesis that the true value of the slope coefficient equals zero.
Unlock Deck
Unlock for access to all 124 flashcards in this deck.
Unlock Deck
k this deck
50
If the estimated slope coefficient is b^ = - 2.45 and the standard error for the slope coefficient is 1.75, which of the following is true using a 95 percent confidence level?
A)The null hypothesis is rejected, meaning that the true slope coefficient is equal to zero.
B)The null hypothesis is not rejected, meaning that the true slope coefficient is not equal to zero.
C)The null hypothesis is rejected, meaning that the true slope coefficient is not equal to zero.
D)The null hypothesis is not rejected, meaning that the true slope coefficient is equal to zero.
Unlock Deck
Unlock for access to all 124 flashcards in this deck.
Unlock Deck
k this deck
51
If Excel estimated the 95 percent confidence interval for a slope coefficient for the price b^ to run from - 25.50 to - 22.30, which of the following is true?
A)You are 95 percent confident that in response to dollar increase in price, consumers will decrease the quantity demanded by an amount that lies between 22.30 and 25.50.
B)You are 95 percent confident that in response to dollar increase in price, consumers will decrease the quantity demanded by an amount greater than 25.50.
C)You are 95 percent confident that in response to dollar increase in price, consumers will decrease the quantity demanded by an amount greater than 22..30.
D)You are 95 percent confident that in response to dollar increase in price, consumers will increase the quantity demanded by an amount that lies between 22.30 and 25.50.
Unlock Deck
Unlock for access to all 124 flashcards in this deck.
Unlock Deck
k this deck
52
If the estimated slope coefficient b^ = - 2.50 and the standard error for the slope coefficient is 0.50, which of the following is true?
A)The t- statistic for the slope coefficient is - 5.0.
B)The t- statistic for the slope coefficient is - 0.2.
C)The P- value for the slope coefficient is - 0.2.
D)The P- value for the slope coefficient is - 5.0.
A)The t- statistic for the slope coefficient is - 5.0.
B)The t- statistic for the slope coefficient is - 0.2.
C)The P- value for the slope coefficient is - 0.2.
D)The P- value for the slope coefficient is - 5.0.
Unlock Deck
Unlock for access to all 124 flashcards in this deck.
Unlock Deck
k this deck
53
Using 95 percent confidence, if the P- value is 0.50, the null hypothesis is rejected.
Unlock Deck
Unlock for access to all 124 flashcards in this deck.
Unlock Deck
k this deck
54
If the estimated slope coefficient is b^ = - 5.45 and the standard error for the slope coefficient is 1.75, which of the following is true using a 95 percent confidence level?
A)The null hypothesis is rejected and you can be 95 percent confidence that the true slope coefficient is not equal to zero.
B)The null hypothesis is not rejected and you can be 95 percent confidence that the true slope coefficient is equal to zero.
C)The null hypothesis is not rejected and you can be 95 percent confidence that the true slope coefficient is not equal to zero.
D)The null hypothesis is rejected and you can be 95 percent confidence that the true slope coefficient is equal to zero.
Unlock Deck
Unlock for access to all 124 flashcards in this deck.
Unlock Deck
k this deck
55
An hypothesis test using 95 percent confidence has a significance level equal to .
A)1
B)0.05
C)0.01
D)0.95
A)1
B)0.05
C)0.01
D)0.95
Unlock Deck
Unlock for access to all 124 flashcards in this deck.
Unlock Deck
k this deck
56
If the absolute value of the t- statistic exceeds critical value, the null hypothesis is rejected.
Unlock Deck
Unlock for access to all 124 flashcards in this deck.
Unlock Deck
k this deck
57
Using Excel, the manager of Quick Breaks Coffees has estimated the daily demand function for its regular coffees; the results are shown in the table above. Using 95 percent confidence, the P- value for the slope coefficient on price suggests which of the following is true?
A)The true slope coefficient is less than the critical value.
B)The true slope coefficient exceeds the critical value.
C)The true slope coefficient is nonzero.
D)The true slope coefficient is zero.
A)The true slope coefficient is less than the critical value.
B)The true slope coefficient exceeds the critical value.
C)The true slope coefficient is nonzero.
D)The true slope coefficient is zero.
Unlock Deck
Unlock for access to all 124 flashcards in this deck.
Unlock Deck
k this deck
58
Using Excel, the manager of Quick Breaks Coffees has estimated the daily demand function for its regular coffees; the results are shown in the table above. Which of the following statements is correct?A)The 99 percent critical value exceeds the t- statistic for the estimated slope coefficient.
B)The manager can be 99 percent confident that the price of coffees affects the quantity demanded.
C)The manager can be 99 percent confident that the true slope coefficient for price is equal to zero.
D)The 95 percent critical value exceeds the t- statistic for the estimated slope coefficient.
Unlock Deck
Unlock for access to all 124 flashcards in this deck.
Unlock Deck
k this deck
59
The larger the standard error for a coefficient, the larger the confidence level.
Unlock Deck
Unlock for access to all 124 flashcards in this deck.
Unlock Deck
k this deck
60
If the P- value for an estimated slope coefficient is 0.25, using 95 percent confidence, which of the following is true?
A)You can be 95 percent confident that the true slop coefficient is nonzero.
B)You should accept the alternative hypothesis that the true value of the coefficient is nonzero.
C)You should fail to reject the null hypothesis.
D)You should reject the null hypothesis.
A)You can be 95 percent confident that the true slop coefficient is nonzero.
B)You should accept the alternative hypothesis that the true value of the coefficient is nonzero.
C)You should fail to reject the null hypothesis.
D)You should reject the null hypothesis.
Unlock Deck
Unlock for access to all 124 flashcards in this deck.
Unlock Deck
k this deck
61
When reviewing reports based on a regression analysis, it is important to consider all of the following except which one?
A)a scatter plot of the actual data
B)the statistical software used to estimate the e regression
C)other factors that affect the dependent variable, but were omitted from the regression
D)the functional form of the estimated regression
A)a scatter plot of the actual data
B)the statistical software used to estimate the e regression
C)other factors that affect the dependent variable, but were omitted from the regression
D)the functional form of the estimated regression
Unlock Deck
Unlock for access to all 124 flashcards in this deck.
Unlock Deck
k this deck
62
If a 2 percent decrease in the price of a good leads to a 6 percent increase in the quantity demanded, the price elasticity of demand for the good equals .
A)2.0
B)3.0
C)6.0
D)0.33
A)2.0
B)3.0
C)6.0
D)0.33
Unlock Deck
Unlock for access to all 124 flashcards in this deck.
Unlock Deck
k this deck
63
Suzie's Bagels is a breakfast deli located on a university campus. Suzie wants to use regression analysis to estimate the demand for her bagel sandwiches. Suzie has collected daily data on the quantity of bagel sandwiches sold over the last year. In order to correctly specify the regression, all of the following variables should be considered except which one?
A)the prices of Suzie's bagel sandwiches
B)the amount of advertising spent by Suzie's competitors
C)the cost of university housing
D)the amount Suzie spent on advertising
A)the prices of Suzie's bagel sandwiches
B)the amount of advertising spent by Suzie's competitors
C)the cost of university housing
D)the amount Suzie spent on advertising
Unlock Deck
Unlock for access to all 124 flashcards in this deck.
Unlock Deck
k this deck
64
You are the owner of a restaurant located in a beach resort in Hawaii and want to use regression analysis to estimate the demand for your fresh seafood dinners. You have collected data on the daily quantity of seafood dinners sold over the last summer season. In order to correctly specify your regression equation, which of the following variables should be considered?
A)the prices charged for scuba diving excursions at the resort
B)the daily number of vacationers at the resort
C)the wages paid to your chef and servers
D)the prices charged for souvenirs in local stores
A)the prices charged for scuba diving excursions at the resort
B)the daily number of vacationers at the resort
C)the wages paid to your chef and servers
D)the prices charged for souvenirs in local stores
Unlock Deck
Unlock for access to all 124 flashcards in this deck.
Unlock Deck
k this deck
65
Regression analyses can be limited by all of the following except which one?
A)omission of relevant variables
B)the specification of the regression
C)the inclusion of a random error term
D)the functional form of the regression
A)omission of relevant variables
B)the specification of the regression
C)the inclusion of a random error term
D)the functional form of the regression
Unlock Deck
Unlock for access to all 124 flashcards in this deck.
Unlock Deck
k this deck
66
You are the owner of a restaurant located in a beach resort in Hawaii and want to use regression analysis to estimate the demand for your fresh seafood dinners. You have collected data on the daily quantity of seafood dinners sold over the last summer season. In order to correctly specify your regression equation, all of the following variables should be considered except which one?
A)the different prices you charged for your seafood dinners
B)the prices a competing seafood restaurant charged for their dinners
C)the number of daily vacationers at the resort
D)the prices charged for umbrellas at the local discount store
A)the different prices you charged for your seafood dinners
B)the prices a competing seafood restaurant charged for their dinners
C)the number of daily vacationers at the resort
D)the prices charged for umbrellas at the local discount store
Unlock Deck
Unlock for access to all 124 flashcards in this deck.
Unlock Deck
k this deck
67
Using Excel, Best Paints estimates the log- linear weekly demand function for their gallon sized
paints to be ln Qd = 16.23 - (1.85 ×
paints to be ln Qd = 16.23 - (1.85 ×
Unlock Deck
Unlock for access to all 124 flashcards in this deck.
Unlock Deck
k this deck
68
If a 2 percent increase in the price of a good leads to a 10 percent decrease in the quantity demanded, the price elasticity of demand for the good equals .
A)5.0
B)2.0
C)0.25
D)0.20
A)5.0
B)2.0
C)0.25
D)0.20
Unlock Deck
Unlock for access to all 124 flashcards in this deck.
Unlock Deck
k this deck
69
Using Excel, Best Paints estimates the log- linear weekly demand function for their gallon sized paints to be ln Qd = 16.23 - (1.85 × ln P). At a price of $20, what is the predicted natural logarithm ^d
Of the quantity (ln Q )?
A)0
B)- 20.77
C)10.69
D)43,914.51
Of the quantity (ln Q )?
A)0
B)- 20.77
C)10.69
D)43,914.51
Unlock Deck
Unlock for access to all 124 flashcards in this deck.
Unlock Deck
k this deck
70
If a scatter plot of the data points for the price and quantity demanded appear to have a convex (bowed inward)shape, estimating a log- linear demand curve will likely yield a R2 that is greater than the R2 from a straight- line demand curve.
Unlock Deck
Unlock for access to all 124 flashcards in this deck.
Unlock Deck
k this deck
71
Suzie's Bagels is a breakfast deli located on a university campus. Suzie wants to use regression analysis to estimate the demand for her bagel sandwiches. Suzie has collected daily data on the quantity of bagel sandwiches sold over the last year. In order to correctly specify the regression, all of the following variables should be considered except which one?
A)the prices charged by Suzie's competitors
B)the prices charged for university t- shirts
C)the amount Suzie spent on advertising
D)the prices of Suzie's bagel sandwiches
A)the prices charged by Suzie's competitors
B)the prices charged for university t- shirts
C)the amount Suzie spent on advertising
D)the prices of Suzie's bagel sandwiches
Unlock Deck
Unlock for access to all 124 flashcards in this deck.
Unlock Deck
k this deck
72
Using Excel, Best Paints estimates the log- linear weekly demand function for their gallon sized paints to be ln Qd = 16.23 - (1.85 × ln P). At a price of $35, what is the predicted natural logarithm ^d
Of the quantity (ln Q )?
A)0
B)15,562.20
C)9.65
D)- 48.52
Of the quantity (ln Q )?
A)0
B)15,562.20
C)9.65
D)- 48.52
Unlock Deck
Unlock for access to all 124 flashcards in this deck.
Unlock Deck
k this deck
73
The scatter diagram above shows the actual data for the price and quantity demanded of a product.Refer to the scatter diagram above. The diagram suggests which of the following?
A)The true demand is likely to be linear it the natural logarithms.
B)The estimated demand curve will have a positive slope.
C)A straight- line demand curve will likely be the best fit.
D)A nonlinear demand curve will likely be the best fit.
Unlock Deck
Unlock for access to all 124 flashcards in this deck.
Unlock Deck
k this deck
74
All of the following are true regarding the price elasticity of demand except which one?
A)It is measured in percentage changes.
B)It measures how much the quantity demanded changes in response to a change in price.
C)It measures the movement along the demand curve in response to a change in price.
D)It measures how much the demand curve shifts in response to a change in price.
A)It is measured in percentage changes.
B)It measures how much the quantity demanded changes in response to a change in price.
C)It measures the movement along the demand curve in response to a change in price.
D)It measures how much the demand curve shifts in response to a change in price.
Unlock Deck
Unlock for access to all 124 flashcards in this deck.
Unlock Deck
k this deck
75
The scatter diagram above shows the actual data for the price and quantity demanded of a product.Refer to the scatter diagram above. The scatter diagram suggests all of the following, except which one?
A)The R2 is likely to be greater when an nonlinear demand curve is estimated compared to a straight- line demand curve.
B)The estimated demand will have a negative slope.
C)A straight- line demand curve is likely to be a better fit to the actual data compared to a nonlinear demand curve.
D)The R2 is likely to be greater when a straight- line demand curve is estimated compared to a nonlinear demand curve.
Unlock Deck
Unlock for access to all 124 flashcards in this deck.
Unlock Deck
k this deck
76
If a 4 percent increase in the price of a good leads to a 1 percent decrease in the quantity demanded, the price elasticity of demand for the good equals .
A)0.33
B)1.0
C)0.25
D)4.0
A)0.33
B)1.0
C)0.25
D)4.0
Unlock Deck
Unlock for access to all 124 flashcards in this deck.
Unlock Deck
k this deck
77
Omitting relevant variables from the regression analysis can bias the regression results.
Unlock Deck
Unlock for access to all 124 flashcards in this deck.
Unlock Deck
k this deck
78
You are the owner of a restaurant located in a beach resort in Hawaii and want to use regression analysis to estimate the demand for your fresh seafood dinners. You have collected data on the daily quantity of seafood dinners sold over the last summer season. In order to correctly specify your regression equation, all of the following variables should be considered except which one?
A)the different prices you charged for your seafood dinners
B)the amount spent of advertising your seafood dinners
C)the prices charged for souvenirs in local stores
D)the prices a competing seafood restaurant charged for their dinners
A)the different prices you charged for your seafood dinners
B)the amount spent of advertising your seafood dinners
C)the prices charged for souvenirs in local stores
D)the prices a competing seafood restaurant charged for their dinners
Unlock Deck
Unlock for access to all 124 flashcards in this deck.
Unlock Deck
k this deck
79
If a nonlinear regression equation provides a better fit to the actual data, but a straight- line regression is estimated, the estimated straight- line regression will have a greater R2 than the R2 from the nonlinear regression.
Unlock Deck
Unlock for access to all 124 flashcards in this deck.
Unlock Deck
k this deck
80
A nonlinear demand curves have positive slope.
Unlock Deck
Unlock for access to all 124 flashcards in this deck.
Unlock Deck
k this deck
Unlock Deck
Unlock for access to all 124 flashcards in this deck.


