Exam 3: Measuring and Using Demand
Exam 1: Managerial Economics and Decision Making90 Questions
Exam 2: Demand and Supply207 Questions
Exam 3: Measuring and Using Demand124 Questions
Exam 4: Production and Costs138 Questions
Exam 5: Perfect Competition120 Questions
Exam 6: Monopoly and Monopolistic Competition149 Questions
Exam 7: Cartels and Oligopoly114 Questions
Exam 8: Game Theory and Oligopoly100 Questions
Exam 9: A Managers Guide to Antitrust Policy175 Questions
Exam 10: Advanced Pricing Decisions120 Questions
Exam 11: Decisions About Vertical Integration and Distribution113 Questions
Exam 12: Decisions About Production, Products, and Location175 Questions
Exam 13: Marketing Decisions: Advertising and Promotion175 Questions
Exam 14: Business Decisions Under Uncertainty200 Questions
Exam 15: Managerial Decisions About Information137 Questions
Exam 16: Using Present Value to Make Multi-Period Managerial Decisions106 Questions
Select questions type
Using Excel, Big Poppa's estimates the weekly demand function for its BBQ sandwiches to be Qd = 1,258.33 - (19.55 × P). In reference to the estimated slope coefficient for price  , which of the following standard errors will provide the smallest 95 percent confidence interval for the slope coefficient?
Free
(Multiple Choice)
4.9/5  (35)
(35)
Correct Answer: Verified
C
The price elasticity for corn from a particular farmer is likely to be________ .
Free
(Multiple Choice)
4.9/5 (32)
Correct Answer:Verified
D
If Excel estimated the 95 percent confidence interval for a slope coefficient for the price to run from - 25.50 to - 22.30, which of the following is true?
Free
(Multiple Choice)
5.0/5 (39)
Correct Answer:Verified
A
If the cross- price elasticity between Goods X and Y is 2.0, the goods are and an increase in the price of Good X will cause a(n)_________in the quantity demanded of Good Y.
(Multiple Choice)
4.7/5 (34)
You are the owner of a boutique clothing store and estimate the price elasticity of demand for your clothing to be 2.50 and the income elasticity of demand for your clothing to be 1.55. If you increase the price of your clothing by 10 percent, which of the following should you expect to occur?
(Multiple Choice)
4.8/5 (31)
If a nonlinear regression equation provides a better fit to the actual data, but a straight- line regression is estimated, the estimated straight- line regression will have a greater R2 than the R2 from the nonlinear regression.
(True/False)
4.8/5 (30)
If a scatter plot of the data points for the price and quantity demanded appear to have a convex (bowed inward)shape, estimating a log- linear demand curve will likely yield a R2 that is greater than the R2 from a straight- line demand curve.
(True/False)
4.7/5 (33)
All of the following are true regarding the standard error of a coefficient except which one?
(Multiple Choice)
4.8/5 (39)
If Excel estimates the demand function for a product to be: Qd = 1,500 - (5 × P)and the actual quantity demanded is 850 when a price of $125 is charged, the estimated residual is 25.
(True/False)
5.0/5 (39)
If the price elasticity of demand for your product is 0.75 and you increase the price of the product, you should expect an increase in total revenue.
(True/False)
4.8/5 (36)
For a linear demand curve, the point elasticity of demand will be greater at higher prices relative to lower prices.
(True/False)
4.8/5 (44)
Because there will always be some random factors the affect demand that cannot be captured, a is ________added to the regression equation.
(Multiple Choice)
4.8/5 (34)
Using Excel, the manager of Quick Breaks Coffees has estimated the daily demand function for its regular coffees; the results are shown in the table above. Which of the following statements is correct?
(Multiple Choice)
4.9/5 (42)
If a 5 percent increase in consumer incomes leads to a 10 percent increase in the quantity demanded for a good, the good is a(n)_________ good with an income elasticity of________ .
(Multiple Choice)
4.9/5 (38)
When reviewing reports based on a regression analysis, it is important to consider all of the following except which one?
(Multiple Choice)
4.9/5 (31)
If the R2 is large, you are confident in the regression results because the predicted values are ________ the actual values.
(Multiple Choice)
4.9/5 (40)
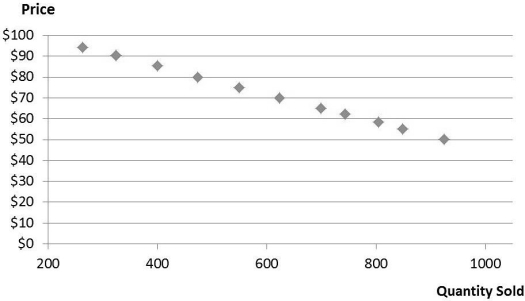 The scatter diagram above shows the actual data for the price and quantity demanded of a product.
-Refer to the scatter diagram above. The scatter diagram suggests all of the following, except which one?
The scatter diagram above shows the actual data for the price and quantity demanded of a product.
-Refer to the scatter diagram above. The scatter diagram suggests all of the following, except which one?
(Multiple Choice)
4.9/5 (41)
If the P- value for an estimated slope coefficient is 0.025, using 95 percent confidence, which of the following is true?
(Multiple Choice)
4.8/5 (37)
Filters
- Essay(0)
- Multiple Choice(0)
- Short Answer(0)
- True False(0)
- Matching(0)