Deck 5: Predictive Analytics I: Trees, K-Nearest Neighbors, Naive Bayes,
Full screen (f)
Question
Question
Question
Question
Question
Question
Question
Question
Question
Question
Question
Question
Question
Question
Question
Question
Question
Question
Question
Question
Question
Suppose that a bank wishes to predict whether or not an existing holder of its Silver credit card will upgrade, for an annual fee, to its Platinum credit card. To do this, the bank carries out a pilot study that randomly selects 40 of its existing Silver card holders and offers each Silver card holder an upgrade to its Platinum card. Here, the response variable Upgrade equals 1 if the Silver card holder decided to upgrade and 0 otherwise. Moreover, the predictor variable Purchases is last year's purchases (in thousands of dollars) by the Silver card holder, and the predictor variable PlatProfile equals 1 if the Silver card holder conforms to the bank's Platinum profile and 0 otherwise. Below is the classification tree they derived from the data collected in the study.  Of these 40 Silver card holders, what is the proportion that did not upgrade?
A) .5535
B) .5250
C) .4750
D) .1179
E) .1000
Of these 40 Silver card holders, what is the proportion that did not upgrade?A) .5535
B) .5250
C) .4750
D) .1179
E) .1000
Question
Suppose that a bank wishes to predict whether or not an existing holder of its Silver credit card will upgrade, for an annual fee, to its Platinum credit card. To do this, the bank carries out a pilot study that randomly selects 40 of its existing Silver card holders and offers each Silver card holder an upgrade to its Platinum card. Here, the response variable Upgrade equals 1 if the Silver card holder decided to upgrade and 0 otherwise. Moreover, the predictor variable Purchases is last year's purchases (in thousands of dollars) by the Silver card holder, and the predictor variable PlatProfile equals 1 if the Silver card holder conforms to the bank's Platinum profile and 0 otherwise. Below is the classification tree they derived from the data collected in the study.  Based on this classification tree, which of the following Silver card holders would the bank classify as a non-upgrader (assuming they classify those with an upgrade probability estimate of at least .5 as upgraders)?
A) PlatProfile(1) & Purchases = 31.50
B) PlatProfile(1) & Purchases = 39.55
C) Purchases = 18.25
D) Purchases = 34.99
E) PlatProfile(0) & Purchases = 49.80
Based on this classification tree, which of the following Silver card holders would the bank classify as a non-upgrader (assuming they classify those with an upgrade probability estimate of at least .5 as upgraders)?A) PlatProfile(1) & Purchases = 31.50
B) PlatProfile(1) & Purchases = 39.55
C) Purchases = 18.25
D) Purchases = 34.99
E) PlatProfile(0) & Purchases = 49.80
Question
Question
An internet service provider (ISP) has randomly selected a sample of 223 observations concerning values of the response variable Churn and several predictor variables based on customer activity during the most recently billed month. Here Churn equals Yes if a customer churned-left the internet service provider for another ISP-and equals No otherwise. The predictor variable MinutesOn is the average daily minutes the customer spent online. EmailSent is the average daily number of emails the customer sent from the email address provided by the ISP. ServCalls is the number of times the customer called for service. Below is part of the classification tree they derived from the data collected in the study.  Of the sampled customers who spent an average of at least 511 minutes online per day and sent an average of fewer than 7 emails per day from their ISP-provided email address, how many churned?
A) 7
B) 8
C) 9
D) 14
E) 32
Of the sampled customers who spent an average of at least 511 minutes online per day and sent an average of fewer than 7 emails per day from their ISP-provided email address, how many churned?A) 7
B) 8
C) 9
D) 14
E) 32
Question
An internet service provider (ISP) has randomly selected a sample of 223 observations concerning values of the response variable Churn and several predictor variables based on customer activity during the most recently billed month. Here Churn equals Yes if a customer churned-left the internet service provider for another ISP-and equals No otherwise. The predictor variable MinutesOn is the average daily minutes the customer spent online. EmailSent is the average daily number of emails the customer sent from the email address provided by the ISP. ServCalls is the number of times the customer called for service. Below is part of the classification tree they derived from the data collected in the study.  Of the sampled customers who spent an average of at least 511 minutes online per day, how many sent an average of at least 7 emails per day from their ISP-provided email address?
A) 14
B) 9
C) 7
D) 5
E) 2
Of the sampled customers who spent an average of at least 511 minutes online per day, how many sent an average of at least 7 emails per day from their ISP-provided email address?A) 14
B) 9
C) 7
D) 5
E) 2
Question
Question
An internet service provider (ISP) has randomly selected a sample of 223 observations concerning values of the response variable Churn and several predictor variables based on customer activity during the most recently billed month. Here Churn equals Yes if a customer churned-left the internet service provider for another ISP-and equals No otherwise. The predictor variable MinutesOn is the average daily minutes the customer spent online. EmailSent is the average daily number of emails the customer sent from the email address provided by the ISP. ServCalls is the number of times the customer called for service. Below is part of the classification tree they derived from the data collected in the study.  Of the sampled customers who spent an average of less than 511 minutes online per day and placed fewer than 3 service calls, what is the sample proportion of those who churned?
A) .067
B) .078
C) .529
D) .861
E) .885
Of the sampled customers who spent an average of less than 511 minutes online per day and placed fewer than 3 service calls, what is the sample proportion of those who churned?A) .067
B) .078
C) .529
D) .861
E) .885
Question
Question
Question
Suppose that a bank wishes to predict whether or not an existing holder of its Silver credit card will upgrade, for an annual fee, to its Platinum credit card. To do this, the bank carries out a pilot study that randomly selects 40 of its existing Silver card holders and offers each Silver card holder an upgrade to its Platinum card. Here, the response variable Upgrade equals 1 if the Silver card holder decided to upgrade and 0 otherwise. Moreover, the predictor variable Purchases is last year's purchases (in thousands of dollars) by the Silver card holder, and the predictor variable PlatProfile equals 1 if the Silver card holder conforms to the bank's Platinum profile and 0 otherwise. Below is the classification tree they derived from the data collected in the study. 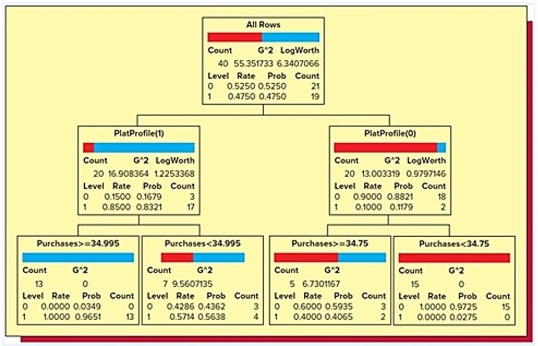 Assume they classify those with an upgrade probability estimate of at least .5 as upgraders. Based on this classification tree, a member of the study sample who made $28,520 in purchases last year and conformed to the bank's Platinum profile but did not upgrade to the Platinum card would be…
A) accurately classified as an upgrader.
B) accurately classified as a non-upgrader.
C) inaccurately classified as an upgrader.
D) inaccurately classified as a non-upgrader.
Assume they classify those with an upgrade probability estimate of at least .5 as upgraders. Based on this classification tree, a member of the study sample who made $28,520 in purchases last year and conformed to the bank's Platinum profile but did not upgrade to the Platinum card would be…A) accurately classified as an upgrader.
B) accurately classified as a non-upgrader.
C) inaccurately classified as an upgrader.
D) inaccurately classified as a non-upgrader.
Question
Question
An internet service provider (ISP) has randomly selected a sample of 223 observations concerning values of the response variable Churn and several predictor variables based on customer activity during the most recently billed month. Here Churn equals Yes if a customer churned-left the internet service provider for another ISP-and equals No otherwise. The predictor variable MinutesOn is the average daily minutes the customer spent online. EmailSent is the average daily number of emails the customer sent from the email address provided by the ISP. ServCalls is the number of times the customer called for service. Below is part of the classification tree they derived from the data collected in the study.  Of the sampled customers who spent an average of at least 511 minutes online per day and sent an average of fewer than 7 emails per day from their ISP-provided email address, what is the sample proportion of those who churned?
A) .078
B) .527
C) .571
D) .778
E) .885
Of the sampled customers who spent an average of at least 511 minutes online per day and sent an average of fewer than 7 emails per day from their ISP-provided email address, what is the sample proportion of those who churned?A) .078
B) .527
C) .571
D) .778
E) .885
Question
Question
Suppose that a bank wishes to predict whether or not an existing holder of its Silver credit card will upgrade, for an annual fee, to its Platinum credit card. To do this, the bank carries out a pilot study that randomly selects 40 of its existing Silver card holders and offers each Silver card holder an upgrade to its Platinum card. Here, the response variable Upgrade equals 1 if the Silver card holder decided to upgrade and 0 otherwise. Moreover, the predictor variable Purchases is last year's purchases (in thousands of dollars) by the Silver card holder, and the predictor variable PlatProfile equals 1 if the Silver card holder conforms to the bank's Platinum profile and 0 otherwise. Below is the classification tree they derived from the data collected in the study.  Assume they classify those with an upgrade probability estimate of at least .5 as upgraders. Based on this classification tree, a member of the study sample who made $50,450 in purchases last year, did not conform to the bank's Platinum profile, and upgraded to the Platinum card would be…
A) accurately classified as an upgrader.
B) accurately classified as a non-upgrader.
C) inaccurately classified as an upgrader.
D) inaccurately classified as a non-upgrader.
Assume they classify those with an upgrade probability estimate of at least .5 as upgraders. Based on this classification tree, a member of the study sample who made $50,450 in purchases last year, did not conform to the bank's Platinum profile, and upgraded to the Platinum card would be…A) accurately classified as an upgrader.
B) accurately classified as a non-upgrader.
C) inaccurately classified as an upgrader.
D) inaccurately classified as a non-upgrader.
Question
Question
Question
An internet service provider (ISP) has randomly selected a sample of 223 observations concerning values of the response variable Churn and several predictor variables based on customer activity during the most recently billed month. Here Churn equals Yes if a customer churned-left the internet service provider for another ISP-and equals No otherwise. The predictor variable MinutesOn is the average daily minutes the customer spent online. EmailSent is the average daily number of emails the customer sent from the email address provided by the ISP. ServCalls is the number of times the customer called for service. Below is part of the classification tree they derived from the data collected in the study.  Of the 223 sampled customers, what is the sample proportion of those who churned?
A) .143
B) .168
C) .571
D) .857
E) .885
Of the 223 sampled customers, what is the sample proportion of those who churned?A) .143
B) .168
C) .571
D) .857
E) .885
Question
Suppose that a bank wishes to predict whether or not an existing holder of its Silver credit card will upgrade, for an annual fee, to its Platinum credit card. To do this, the bank carries out a pilot study that randomly selects 40 of its existing Silver card holders and offers each Silver card holder an upgrade to its Platinum card. Here, the response variable Upgrade equals 1 if the Silver card holder decided to upgrade and 0 otherwise. Moreover, the predictor variable Purchases is last year's purchases (in thousands of dollars) by the Silver card holder, and the predictor variable PlatProfile equals 1 if the Silver card holder conforms to the bank's Platinum profile and 0 otherwise. Below is the classification tree they derived from the data collected in the study.  Based on this classification tree, which of the following Silver card holders would the bank classify as an upgrader (assuming they classify those with an upgrade probability estimate of at least .5 as upgraders)?
A) PlatProfile(0) & Purchases = 31.50
B) PlatProfile(1)
C) Purchases = 48.25
D) Purchases = 34.99
E) PlatProfile(0) & Purchases = 34.75
Based on this classification tree, which of the following Silver card holders would the bank classify as an upgrader (assuming they classify those with an upgrade probability estimate of at least .5 as upgraders)?A) PlatProfile(0) & Purchases = 31.50
B) PlatProfile(1)
C) Purchases = 48.25
D) Purchases = 34.99
E) PlatProfile(0) & Purchases = 34.75
Question
Question
Question
An automobile finance company analyzed a sample of recent automobile loans to try to determine key factors in identifying borrowers who would be likely to default on their auto loan. The response variable Default equals 1 if the borrower defaulted during the term of the loan and 0 otherwise. The predictor variable AutoDebt% was the ratio (expressed as a percent) of the required loan payments to the borrower's take-home income at the time of purchase. JobTime was the number of years the borrower had worked at their current job at the time of purchase. CredScore was the borrower's credit score at the time of purchase. Below is part of the classification tree the finance company derived from the data collected in the study. Assume they classify those with a default probability estimate of at least .5 as Defaulters.  Based on this classification tree, a member of the study sample who had a credit score of 724, been at their current job for 2 years, took out a loan with payments equaling 20% of their income, and did not default would be
A) inaccurately classified as a Defaulter.
B) inaccurately classified as a non-Defaulter.
C) accurately classified as a Defaulter.
D) accurately classified as a non-Defaulter.
Based on this classification tree, a member of the study sample who had a credit score of 724, been at their current job for 2 years, took out a loan with payments equaling 20% of their income, and did not default would beA) inaccurately classified as a Defaulter.
B) inaccurately classified as a non-Defaulter.
C) accurately classified as a Defaulter.
D) accurately classified as a non-Defaulter.
Question
An internet service provider (ISP) has randomly selected a sample of 223 observations concerning values of the response variable Churn and several predictor variables based on customer activity during the most recently billed month. Here Churn equals Yes if a customer churned-left the internet service provider for another ISP-and equals No otherwise. The predictor variable MinutesOn is the average daily minutes the customer spent online. EmailSent is the average daily number of emails the customer sent from the email address provided by the ISP. ServCalls is the number of times the customer called for service. Below is part of the classification tree they derived from the data collected in the study.  Of the sampled customers who spent an average of at least 511 minutes online per day and sent an average of at least 7 emails per day from their ISP-provided email address, how many did not churn?
A) 4
B) 6
C) 7
D) 9
E) 2
Of the sampled customers who spent an average of at least 511 minutes online per day and sent an average of at least 7 emails per day from their ISP-provided email address, how many did not churn?A) 4
B) 6
C) 7
D) 9
E) 2
Question
An automobile finance company analyzed a sample of recent automobile loans to try to determine key factors in identifying borrowers who would be likely to default on their auto loan. The response variable Default equals 1 if the borrower defaulted during the term of the loan and 0 otherwise. The predictor variable AutoDebt% was the ratio (expressed as a percent) of the required loan payments to the borrower's take-home income at the time of purchase. JobTime was the number of years the borrower had worked at their current job at the time of purchase. CredScore was the borrower's credit score at the time of purchase. Below is part of the classification tree the finance company derived from the data collected in the study. Assume they classify those with a default probability estimate of at least .5 as Defaulters.  Based on this classification tree, a member of the study sample who had a credit score of 698, had just started a new job, took out a loan with payments equaling 7% of their income, and defaulted would be
A) inaccurately classified as a Defaulter.
B) inaccurately classified as a non-Defaulter.
C) accurately classified as a Defaulter.
D) accurately classified as a non-Defaulter.
Based on this classification tree, a member of the study sample who had a credit score of 698, had just started a new job, took out a loan with payments equaling 7% of their income, and defaulted would beA) inaccurately classified as a Defaulter.
B) inaccurately classified as a non-Defaulter.
C) accurately classified as a Defaulter.
D) accurately classified as a non-Defaulter.
Question
An automobile finance company analyzed a sample of recent automobile loans to try to determine key factors in identifying borrowers who would be likely to default on their auto loan. The response variable Default equals 1 if the borrower defaulted during the term of the loan and 0 otherwise. The predictor variable AutoDebt% was the ratio (expressed as a percent) of the required loan payments to the borrower's take-home income at the time of purchase. JobTime was the number of years the borrower had worked at their current job at the time of purchase. CredScore was the borrower's credit score at the time of purchase. Below is part of the classification tree the finance company derived from the data collected in the study. Assume they classify those with a default probability estimate of at least .5 as Defaulters.  Based on this classification tree, a member of the study sample who had a credit score of 423, been at their current job for 4 years, took out a loan with payments equaling 22% of their income, and did not default would be
A) inaccurately classified as a Defaulter.
B) inaccurately classified as a non-Defaulter.
C) accurately classified as a Defaulter.
D) accurately classified as a non-Defaulter.
Based on this classification tree, a member of the study sample who had a credit score of 423, been at their current job for 4 years, took out a loan with payments equaling 22% of their income, and did not default would beA) inaccurately classified as a Defaulter.
B) inaccurately classified as a non-Defaulter.
C) accurately classified as a Defaulter.
D) accurately classified as a non-Defaulter.
Question
An automobile finance company analyzed a sample of recent automobile loans to try to determine key factors in identifying borrowers who would be likely to default on their auto loan. The response variable Default equals 1 if the borrower defaulted during the term of the loan and 0 otherwise. The predictor variable AutoDebt% was the ratio (expressed as a percent) of the required loan payments to the borrower's take-home income at the time of purchase. JobTime was the number of years the borrower had worked at their current job at the time of purchase. CredScore was the borrower's credit score at the time of purchase. Below is part of the classification tree the finance company derived from the data collected in the study. Assume they classify those with a default probability estimate of at least .5 as Defaulters.  Based on this classification tree, a member of the study sample who had a credit score of 819, been at their current job for 3 years, took out a loan with payments equaling 15% of their income, and did not default would be
A) inaccurately classified as a Defaulter.
B) inaccurately classified as a non-Defaulter.
C) accurately classified as a Defaulter.
D) accurately classified as a non-Defaulter.
Based on this classification tree, a member of the study sample who had a credit score of 819, been at their current job for 3 years, took out a loan with payments equaling 15% of their income, and did not default would beA) inaccurately classified as a Defaulter.
B) inaccurately classified as a non-Defaulter.
C) accurately classified as a Defaulter.
D) accurately classified as a non-Defaulter.
Question
An automobile finance company analyzed a sample of recent automobile loans to try to determine key factors in identifying borrowers who would be likely to default on their auto loan. The response variable Default equals 1 if the borrower defaulted during the term of the loan and 0 otherwise. The predictor variable AutoDebt% was the ratio (expressed as a percent) of the required loan payments to the borrower's take-home income at the time of purchase. JobTime was the number of years the borrower had worked at their current job at the time of purchase. CredScore was the borrower's credit score at the time of purchase. Below is part of the classification tree the finance company derived from the data collected in the study. Assume they classify those with a default probability estimate of at least .5 as Defaulters.  Based on this classification tree, a member of the study sample who had a credit score of 523, been at their current job for 1 year, took out a loan with payments equaling 17% of their income, and defaulted would be
A) inaccurately classified as a Defaulter.
B) inaccurately classified as a non-Defaulter.
C) accurately classified as a Defaulter.
D) accurately classified as a non-Defaulter.
Based on this classification tree, a member of the study sample who had a credit score of 523, been at their current job for 1 year, took out a loan with payments equaling 17% of their income, and defaulted would beA) inaccurately classified as a Defaulter.
B) inaccurately classified as a non-Defaulter.
C) accurately classified as a Defaulter.
D) accurately classified as a non-Defaulter.
Question
An automobile finance company analyzed a sample of recent automobile loans to try to determine key factors in identifying borrowers who would be likely to default on their auto loan. The response variable Default equals 1 if the borrower defaulted during the term of the loan and 0 otherwise. The predictor variable AutoDebt% was the ratio (expressed as a percent) of the required loan payments to the borrower's take-home income at the time of purchase. JobTime was the number of years the borrower had worked at their current job at the time of purchase. CredScore was the borrower's credit score at the time of purchase. Below is part of the classification tree the finance company derived from the data collected in the study. Assume they classify those with a default probability estimate of at least .5 as Defaulters.  Based on this classification tree, a member of the study sample who had a credit score of 667, been at their current job for 3 years, took out a loan with payments equaling 13% of their income, and did not default would be
A) inaccurately classified as a Defaulter.
B) inaccurately classified as a non-Defaulter.
C) accurately classified as a Defaulter.
D) accurately classified as a non-Defaulter.
Based on this classification tree, a member of the study sample who had a credit score of 667, been at their current job for 3 years, took out a loan with payments equaling 13% of their income, and did not default would beA) inaccurately classified as a Defaulter.
B) inaccurately classified as a non-Defaulter.
C) accurately classified as a Defaulter.
D) accurately classified as a non-Defaulter.
Question
An internet service provider (ISP) has randomly selected a sample of 223 observations concerning values of the response variable Churn and several predictor variables based on customer activity during the most recently billed month. Here Churn equals Yes if a customer churned-left the internet service provider for another ISP-and equals No otherwise. The predictor variable MinutesOn is the average daily minutes the customer spent online. EmailSent is the average daily number of emails the customer sent from the email address provided by the ISP. ServCalls is the number of times the customer called for service. Below is part of the classification tree they derived from the data collected in the study.  Of the sampled customers who spent an average of at least 511 minutes online per day and sent an average of less than 7 emails per day from their ISP-provided email address, what is the sample proportion of those who did not churn?
A) .078
B) .143
C) .200
D) .211
E) .222
Of the sampled customers who spent an average of at least 511 minutes online per day and sent an average of less than 7 emails per day from their ISP-provided email address, what is the sample proportion of those who did not churn?A) .078
B) .143
C) .200
D) .211
E) .222
Question
An automobile finance company analyzed a sample of recent automobile loans to try to determine key factors in identifying borrowers who would be likely to default on their auto loan. The response variable Default equals 1 if the borrower defaulted during the term of the loan and 0 otherwise. The predictor variable AutoDebt% was the ratio (expressed as a percent) of the required loan payments to the borrower's take-home income at the time of purchase. JobTime was the number of years the borrower had worked at their current job at the time of purchase. CredScore was the borrower's credit score at the time of purchase. Below is part of the classification tree the finance company derived from the data collected in the study. Assume they classify those with a default probability estimate of at least .5 as Defaulters.  Based on this classification tree, a member of the study sample who had a credit score of 774, just started their current job, took out a loan with payments equaling 19% of their income, and did not default would be
A) inaccurately classified as a Defaulter.
B) inaccurately classified as a non-Defaulter.
C) accurately classified as a Defaulter.
D) accurately classified as a non-Defaulter.
Based on this classification tree, a member of the study sample who had a credit score of 774, just started their current job, took out a loan with payments equaling 19% of their income, and did not default would beA) inaccurately classified as a Defaulter.
B) inaccurately classified as a non-Defaulter.
C) accurately classified as a Defaulter.
D) accurately classified as a non-Defaulter.
Question
An automobile finance company analyzed a sample of recent automobile loans to try to determine key factors in identifying borrowers who would be likely to default on their auto loan. The response variable Default equals 1 if the borrower defaulted during the term of the loan and 0 otherwise. The predictor variable AutoDebt% was the ratio (expressed as a percent) of the required loan payments to the borrower's take-home income at the time of purchase. JobTime was the number of years the borrower had worked at their current job at the time of purchase. CredScore was the borrower's credit score at the time of purchase. Below is part of the classification tree the finance company derived from the data collected in the study. Assume they classify those with a default probability estimate of at least .5 as Defaulters.  Based on this classification tree, a member of the study sample who had a credit score of 786, just started their current job, took out a loan with payments equaling 9% of their income, and defaulted would be
A) inaccurately classified as a Defaulter.
B) inaccurately classified as a non-Defaulter.
C) accurately classified as a Defaulter.
D) accurately classified as a non-Defaulter.
Based on this classification tree, a member of the study sample who had a credit score of 786, just started their current job, took out a loan with payments equaling 9% of their income, and defaulted would beA) inaccurately classified as a Defaulter.
B) inaccurately classified as a non-Defaulter.
C) accurately classified as a Defaulter.
D) accurately classified as a non-Defaulter.
Question
An internet service provider (ISP) has randomly selected a sample of 223 observations concerning values of the response variable Churn and several predictor variables based on customer activity during the most recently billed month. Here Churn equals Yes if a customer churned-left the internet service provider for another ISP-and equals No otherwise. The predictor variable MinutesOn is the average daily minutes the customer spent online. EmailSent is the average daily number of emails the customer sent from the email address provided by the ISP. ServCalls is the number of times the customer called for service. Below is part of the classification tree they derived from the data collected in the study.  Of the sampled customers who spent an average of at least 511 minutes online per day and sent an average of at least 7 emails per day from their ISP-provided email address, what is the sample proportion of those who did not churn?
A) .800
B) .778
C) .429
D) .222
E) .200
Of the sampled customers who spent an average of at least 511 minutes online per day and sent an average of at least 7 emails per day from their ISP-provided email address, what is the sample proportion of those who did not churn?A) .800
B) .778
C) .429
D) .222
E) .200
Question
An internet service provider (ISP) has randomly selected a sample of 223 observations concerning values of the response variable Churn and several predictor variables based on customer activity during the most recently billed month. Here Churn equals Yes if a customer churned-left the internet service provider for another ISP-and equals No otherwise. The predictor variable MinutesOn is the average daily minutes the customer spent online. EmailSent is the average daily number of emails the customer sent from the email address provided by the ISP. ServCalls is the number of times the customer called for service. Below is part of the classification tree they derived from the data collected in the study.  Of the sampled customers who spent an average of at least 511 minutes online per day, how many did not churn?
A) 14
B) 9
C) 7
D) 6
E) 5
Of the sampled customers who spent an average of at least 511 minutes online per day, how many did not churn?A) 14
B) 9
C) 7
D) 6
E) 5
Question
An internet service provider (ISP) has randomly selected a sample of 223 observations concerning values of the response variable Churn and several predictor variables based on customer activity during the most recently billed month. Here Churn equals Yes if a customer churned-left the internet service provider for another ISP-and equals No otherwise. The predictor variable MinutesOn is the average daily minutes the customer spent online. EmailSent is the average daily number of emails the customer sent from the email address provided by the ISP. ServCalls is the number of times the customer called for service. Below is part of the classification tree they derived from the data collected in the study.  Of the sampled customers who spent an average of less than 511 minutes online per day and placed at least 3 service calls, how many did not churn?
A) 7
B) 8
C) 9
D) 15
E) 17
Of the sampled customers who spent an average of less than 511 minutes online per day and placed at least 3 service calls, how many did not churn?A) 7
B) 8
C) 9
D) 15
E) 17
Question
An internet service provider (ISP) has randomly selected a sample of 223 observations concerning values of the response variable Churn and several predictor variables based on customer activity during the most recently billed month. Here Churn equals Yes if a customer churned-left the internet service provider for another ISP-and equals No otherwise. The predictor variable MinutesOn is the average daily minutes the customer spent online. EmailSent is the average daily number of emails the customer sent from the email address provided by the ISP. ServCalls is the number of times the customer called for service. Below is part of the classification tree they derived from the data collected in the study.  Of the 223 sampled customers, what is the sample proportion of those who did not churn?
A) .078
B) .143
C) .168
D) .571
E) .857
Of the 223 sampled customers, what is the sample proportion of those who did not churn?A) .078
B) .143
C) .168
D) .571
E) .857
Question
An internet service provider (ISP) has randomly selected a sample of 223 observations concerning values of the response variable Churn and several predictor variables based on customer activity during the most recently billed month. Here Churn equals Yes if a customer churned-left the internet service provider for another ISP-and equals No otherwise. The predictor variable MinutesOn is the average daily minutes the customer spent online. EmailSent is the average daily number of emails the customer sent from the email address provided by the ISP. ServCalls is the number of times the customer called for service. Below is part of the classification tree they derived from the data collected in the study.  Of the sampled customers who spent an average of at least 511 minutes online per day and sent an average of at least 7 emails per day from their ISP-provided email address, how many churned?
A) 9
B) 7
C) 5
D) 2
E) 1
Of the sampled customers who spent an average of at least 511 minutes online per day and sent an average of at least 7 emails per day from their ISP-provided email address, how many churned?A) 9
B) 7
C) 5
D) 2
E) 1
Question
An internet service provider (ISP) has randomly selected a sample of 223 observations concerning values of the response variable Churn and several predictor variables based on customer activity during the most recently billed month. Here Churn equals Yes if a customer churned-left the internet service provider for another ISP-and equals No otherwise. The predictor variable MinutesOn is the average daily minutes the customer spent online. EmailSent is the average daily number of emails the customer sent from the email address provided by the ISP. ServCalls is the number of times the customer called for service. Below is part of the classification tree they derived from the data collected in the study. 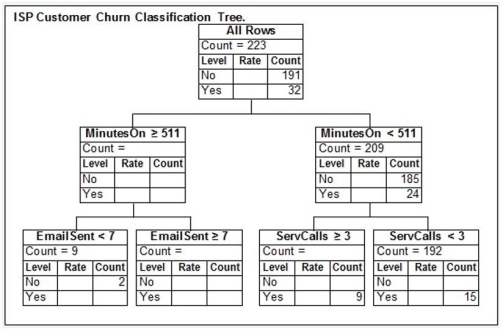 Of the sampled customers who spent an average of less than 511 minutes online per day and placed at least 3 service calls, what is the sample proportion of those who did not churn?
A) .078
B) .471
C) .529
D) .571
E) .922
Of the sampled customers who spent an average of less than 511 minutes online per day and placed at least 3 service calls, what is the sample proportion of those who did not churn?A) .078
B) .471
C) .529
D) .571
E) .922
Question
An internet service provider (ISP) has randomly selected a sample of 223 observations concerning values of the response variable Churn and several predictor variables based on customer activity during the most recently billed month. Here Churn equals Yes if a customer churned-left the internet service provider for another ISP-and equals No otherwise. The predictor variable MinutesOn is the average daily minutes the customer spent online. EmailSent is the average daily number of emails the customer sent from the email address provided by the ISP. ServCalls is the number of times the customer called for service. Below is part of the classification tree they derived from the data collected in the study.  Of the sampled customers who spent an average of at least 511 minutes online per day and sent an average of at least 7 emails per day from their ISP-provided email address, what is the sample proportion of those who churned?
A) .078
B) .143
C) .200
D) .571
E) .778
Of the sampled customers who spent an average of at least 511 minutes online per day and sent an average of at least 7 emails per day from their ISP-provided email address, what is the sample proportion of those who churned?A) .078
B) .143
C) .200
D) .571
E) .778
Question
An automobile finance company analyzed a sample of recent automobile loans to try to determine key factors in identifying borrowers who would be likely to default on their auto loan. The response variable Default equals 1 if the borrower defaulted during the term of the loan and 0 otherwise. The predictor variable AutoDebt% was the ratio (expressed as a percent) of the required loan payments to the borrower's take-home income at the time of purchase. JobTime was the number of years the borrower had worked at their current job at the time of purchase. CredScore was the borrower's credit score at the time of purchase. Below is part of the classification tree the finance company derived from the data collected in the study. Assume they classify those with a default probability estimate of at least .5 as Defaulters.  Based on this classification tree, a member of the study sample who had a credit score of 802, been at their current job for 1 year, took out a loan with payments equaling 19% of their income, and defaulted would be
A) inaccurately classified as a Defaulter.
B) inaccurately classified as a non-Defaulter.
C) accurately classified as a Defaulter.
D) accurately classified as a non-Defaulter.
Based on this classification tree, a member of the study sample who had a credit score of 802, been at their current job for 1 year, took out a loan with payments equaling 19% of their income, and defaulted would beA) inaccurately classified as a Defaulter.
B) inaccurately classified as a non-Defaulter.
C) accurately classified as a Defaulter.
D) accurately classified as a non-Defaulter.
Question
An automobile finance company analyzed a sample of recent automobile loans to try to determine key factors in identifying borrowers who would be likely to default on their auto loan. The response variable Default equals 1 if the borrower defaulted during the term of the loan and 0 otherwise. The predictor variable AutoDebt% was the ratio (expressed as a percent) of the required loan payments to the borrower's take-home income at the time of purchase. JobTime was the number of years the borrower had worked at their current job at the time of purchase. CredScore was the borrower's credit score at the time of purchase. Below is part of the classification tree the finance company derived from the data collected in the study. Assume they classify those with a default probability estimate of at least .5 as Defaulters.  Based on this classification tree, a member of the study sample who had a credit score of 537, been at their current job for 12 years, took out a loan with payments equaling 16% of their income, and defaulted would be
A) inaccurately classified as a Defaulter.
B) inaccurately classified as a non-Defaulter.
C) accurately classified as a Defaulter.
D) accurately classified as a non-Defaulter.
Based on this classification tree, a member of the study sample who had a credit score of 537, been at their current job for 12 years, took out a loan with payments equaling 16% of their income, and defaulted would beA) inaccurately classified as a Defaulter.
B) inaccurately classified as a non-Defaulter.
C) accurately classified as a Defaulter.
D) accurately classified as a non-Defaulter.
Question
An internet service provider (ISP) has randomly selected a sample of 223 observations concerning values of the response variable Churn and several predictor variables based on customer activity during the most recently billed month. Here Churn equals Yes if a customer churned-left the internet service provider for another ISP-and equals No otherwise. The predictor variable MinutesOn is the average daily minutes the customer spent online. EmailSent is the average daily number of emails the customer sent from the email address provided by the ISP. ServCalls is the number of times the customer called for service. Below is part of the classification tree they derived from the data collected in the study.  Assume they classify those with a churn probability estimate (based on the sample proportion) of at least .5 as churners. Based on this classification tree, a member of the study sample who spent an average of 327 minutes online per day, sent an average of 4 emails per day from their ISP-provided email address, placed no service calls, and churned would be
A) inaccurately classified as a churner.
B) inaccurately classified as a non-churner.
C) accurately classified as a churner.
D) accurately classified as a non-churner.
Assume they classify those with a churn probability estimate (based on the sample proportion) of at least .5 as churners. Based on this classification tree, a member of the study sample who spent an average of 327 minutes online per day, sent an average of 4 emails per day from their ISP-provided email address, placed no service calls, and churned would beA) inaccurately classified as a churner.
B) inaccurately classified as a non-churner.
C) accurately classified as a churner.
D) accurately classified as a non-churner.
Question
An automobile finance company analyzed a sample of recent automobile loans to try to determine key factors in identifying borrowers who would be likely to default on their auto loan. The response variable Default equals 1 if the borrower defaulted during the term of the loan and 0 otherwise. The predictor variable AutoDebt% was the ratio (expressed as a percent) of the required loan payments to the borrower's take-home income at the time of purchase. JobTime was the number of years the borrower had worked at their current job at the time of purchase. CredScore was the borrower's credit score at the time of purchase. Below is part of the classification tree the finance company derived from the data collected in the study. Assume they classify those with a default probability estimate of at least .5 as Defaulters.  A potential borrower who has just started their current job would like to apply for a loan with payments equaling 17% of their income. To be approved for the loan they would need to be classified as a non-Defaulter. Of the following credit scores, which is the lowest this potential borrower could have to be approved for the loan?
A) 421
B) 724
C) 795
D) There is no credit score which would allow them to be classified as a non-Defaulter.
E) There is insufficient information to determine the minimum allowable credit score.
A potential borrower who has just started their current job would like to apply for a loan with payments equaling 17% of their income. To be approved for the loan they would need to be classified as a non-Defaulter. Of the following credit scores, which is the lowest this potential borrower could have to be approved for the loan?A) 421
B) 724
C) 795
D) There is no credit score which would allow them to be classified as a non-Defaulter.
E) There is insufficient information to determine the minimum allowable credit score.
Question
An automobile finance company analyzed a sample of recent automobile loans to try to determine key factors in identifying borrowers who would be likely to default on their auto loan. The response variable Default equals 1 if the borrower defaulted during the term of the loan and 0 otherwise. The predictor variable AutoDebt% was the ratio (expressed as a percent) of the required loan payments to the borrower's take-home income at the time of purchase. JobTime was the number of years the borrower had worked at their current job at the time of purchase. CredScore was the borrower's credit score at the time of purchase. Below is part of the classification tree the finance company derived from the data collected in the study. Assume they classify those with a default probability estimate of at least .5 as Defaulters.  A potential borrower who has been at their current job for 1 year would like to apply for a loan with payments equaling 21% of their income. To be approved for the loan they would need to be classified as a non-Defaulter. Of the following credit scores, which is the lowest this potential borrower could have to be approved for the loan?
A) 421
B) 723
C) 795
D) There is no credit score which would allow them to be classified as a non-Defaulter.
E) There is insufficient information to determine the minimum allowable credit score.
A potential borrower who has been at their current job for 1 year would like to apply for a loan with payments equaling 21% of their income. To be approved for the loan they would need to be classified as a non-Defaulter. Of the following credit scores, which is the lowest this potential borrower could have to be approved for the loan?A) 421
B) 723
C) 795
D) There is no credit score which would allow them to be classified as a non-Defaulter.
E) There is insufficient information to determine the minimum allowable credit score.
Question
An MBA admissions officer wishes to predict an MBA applicant's grade point average (GPA) for the MBA program on the basis of the applicant's score on the Graduate Management Admission Test (GMAT) and their undergraduate GPA (UGPA). The admissions officer used a random sample of previously admitted applicants to build a regression tree that can be used to predict the MBA GPAs of future MBA students. Below is the final regression tree. 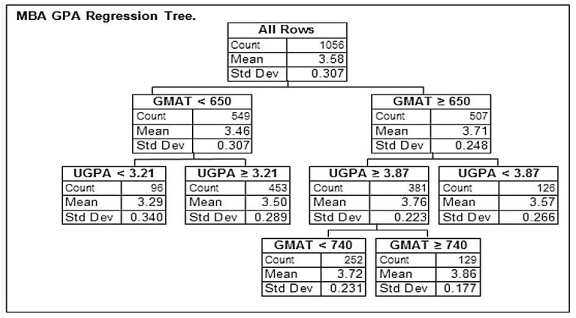 Based on this regression tree, how many of the admitted applicants in the sample had a GMAT score of at least 650?
A) 381
B) 507
C) 1056
D) 1395
E) There is insufficient information to determine the answer.
Based on this regression tree, how many of the admitted applicants in the sample had a GMAT score of at least 650?A) 381
B) 507
C) 1056
D) 1395
E) There is insufficient information to determine the answer.
Question
An automobile finance company analyzed a sample of recent automobile loans to try to determine key factors in identifying borrowers who would be likely to default on their auto loan. The response variable Default equals 1 if the borrower defaulted during the term of the loan and 0 otherwise. The predictor variable AutoDebt% was the ratio (expressed as a percent) of the required loan payments to the borrower's take-home income at the time of purchase. JobTime was the number of years the borrower had worked at their current job at the time of purchase. CredScore was the borrower's credit score at the time of purchase. Below is part of the classification tree the finance company derived from the data collected in the study. Assume they classify those with a default probability estimate of at least .5 as Defaulters.  A potential borrower with a credit score of 792 who has been at their current job for 1 year and has a monthly income of $3,000 would like to apply for a loan. To be approved for the loan they would need to be classified as a non-Defaulter. Of the following monthly payments, which is the highest this loan could have to be approved for this potential borrower?
A) $381
B) $534
C) $595
D) None of these monthly payments would allow them to be classified as a non-Defaulter.
E) There is insufficient information to determine the maximum allowable monthly payment.
A potential borrower with a credit score of 792 who has been at their current job for 1 year and has a monthly income of $3,000 would like to apply for a loan. To be approved for the loan they would need to be classified as a non-Defaulter. Of the following monthly payments, which is the highest this loan could have to be approved for this potential borrower?A) $381
B) $534
C) $595
D) None of these monthly payments would allow them to be classified as a non-Defaulter.
E) There is insufficient information to determine the maximum allowable monthly payment.
Question
An automobile finance company analyzed a sample of recent automobile loans to try to determine key factors in identifying borrowers who would be likely to default on their auto loan. The response variable Default equals 1 if the borrower defaulted during the term of the loan and 0 otherwise. The predictor variable AutoDebt% was the ratio (expressed as a percent) of the required loan payments to the borrower's take-home income at the time of purchase. JobTime was the number of years the borrower had worked at their current job at the time of purchase. CredScore was the borrower's credit score at the time of purchase. Below is part of the classification tree the finance company derived from the data collected in the study. Assume they classify those with a default probability estimate of at least .5 as Defaulters.  A potential borrower with a credit score of 723 who has been at their current job for 7 years is applying for a loan with payments equaling 11% of their income. Based on this classification tree, the best estimate of the probability that this loan applicant would default would be ________.
A) .000
B) .077
C) .181
D) .761
E) 1.000
A potential borrower with a credit score of 723 who has been at their current job for 7 years is applying for a loan with payments equaling 11% of their income. Based on this classification tree, the best estimate of the probability that this loan applicant would default would be ________.A) .000
B) .077
C) .181
D) .761
E) 1.000
Question
An automobile finance company analyzed a sample of recent automobile loans to try to determine key factors in identifying borrowers who would be likely to default on their auto loan. The response variable Default equals 1 if the borrower defaulted during the term of the loan and 0 otherwise. The predictor variable AutoDebt% was the ratio (expressed as a percent) of the required loan payments to the borrower's take-home income at the time of purchase. JobTime was the number of years the borrower had worked at their current job at the time of purchase. CredScore was the borrower's credit score at the time of purchase. Below is part of the classification tree the finance company derived from the data collected in the study. Assume they classify those with a default probability estimate of at least .5 as Defaulters.  A potential borrower with a credit score of 724 who has been at their current job for 3 years and has a monthly salary of $6,000 would like to apply for a loan. To be approved for the loan they would need to be classified as a non-Defaulter. Of the following monthly payments, which is the highest this loan could have to be approved for this potential borrower?
A) $591
B) $964
C) $1,295
D) None of these monthly payments would allow them to be classified as a non-Defaulter.
E) There is insufficient information to determine the maximum allowable monthly payment.
A potential borrower with a credit score of 724 who has been at their current job for 3 years and has a monthly salary of $6,000 would like to apply for a loan. To be approved for the loan they would need to be classified as a non-Defaulter. Of the following monthly payments, which is the highest this loan could have to be approved for this potential borrower?A) $591
B) $964
C) $1,295
D) None of these monthly payments would allow them to be classified as a non-Defaulter.
E) There is insufficient information to determine the maximum allowable monthly payment.
Question
An automobile finance company analyzed a sample of recent automobile loans to try to determine key factors in identifying borrowers who would be likely to default on their auto loan. The response variable Default equals 1 if the borrower defaulted during the term of the loan and 0 otherwise. The predictor variable AutoDebt% was the ratio (expressed as a percent) of the required loan payments to the borrower's take-home income at the time of purchase. JobTime was the number of years the borrower had worked at their current job at the time of purchase. CredScore was the borrower's credit score at the time of purchase. Below is part of the classification tree the finance company derived from the data collected in the study. Assume they classify those with a default probability estimate of at least .5 as Defaulters.  A potential borrower with a credit score of 724 who has been at their current job for 6 years is applying for a loan with payments equaling 21% of their income. Based on this classification tree, the best estimate of the probability that this loan applicant would default would be
A) .000
B) .123
C) .181
D) .891
E) 1.000
A potential borrower with a credit score of 724 who has been at their current job for 6 years is applying for a loan with payments equaling 21% of their income. Based on this classification tree, the best estimate of the probability that this loan applicant would default would beA) .000
B) .123
C) .181
D) .891
E) 1.000
Question
An MBA admissions officer wishes to predict an MBA applicant's grade point average (GPA) for the MBA program on the basis of the applicant's score on the Graduate Management Admission Test (GMAT) and their undergraduate GPA (UGPA). The admissions officer used a random sample of previously admitted applicants to build a regression tree that can be used to predict the MBA GPAs of future MBA students. Below is the final regression tree.  Based on this regression tree, how many of the admitted applicants in the sample had both a GMAT score of at least 740 and an undergraduate GPA of at least 3.87?
A) 129
B) 252
C) 381
D) 510
E) There is insufficient information to determine the answer.
Based on this regression tree, how many of the admitted applicants in the sample had both a GMAT score of at least 740 and an undergraduate GPA of at least 3.87?A) 129
B) 252
C) 381
D) 510
E) There is insufficient information to determine the answer.
Question
An automobile finance company analyzed a sample of recent automobile loans to try to determine key factors in identifying borrowers who would be likely to default on their auto loan. The response variable Default equals 1 if the borrower defaulted during the term of the loan and 0 otherwise. The predictor variable AutoDebt% was the ratio (expressed as a percent) of the required loan payments to the borrower's take-home income at the time of purchase. JobTime was the number of years the borrower had worked at their current job at the time of purchase. CredScore was the borrower's credit score at the time of purchase. Below is part of the classification tree the finance company derived from the data collected in the study. Assume they classify those with a default probability estimate of at least .5 as Defaulters.  A potential borrower with a credit score of 668 who has just started their current job is applying for a loan with payments equaling 7% of their income. Based on this classification tree, the best estimate of the probability that this loan applicant would default would be ________.
A) .000
B) .181
C) .239
D) .867
E) 1.000
A potential borrower with a credit score of 668 who has just started their current job is applying for a loan with payments equaling 7% of their income. Based on this classification tree, the best estimate of the probability that this loan applicant would default would be ________.A) .000
B) .181
C) .239
D) .867
E) 1.000
Question
An automobile finance company analyzed a sample of recent automobile loans to try to determine key factors in identifying borrowers who would be likely to default on their auto loan. The response variable Default equals 1 if the borrower defaulted during the term of the loan and 0 otherwise. The predictor variable AutoDebt% was the ratio (expressed as a percent) of the required loan payments to the borrower's take-home income at the time of purchase. JobTime was the number of years the borrower had worked at their current job at the time of purchase. CredScore was the borrower's credit score at the time of purchase. Below is part of the classification tree the finance company derived from the data collected in the study. Assume they classify those with a default probability estimate of at least .5 as Defaulters.  A potential borrower with a credit score of 752 who just started their current job is applying for a loan with payments equaling 19% of their income. Based on this classification tree, the best estimate of the probability that this loan applicant would default would be
A) .000
B) .077
C) .253
D) .747
E) 1.000
A potential borrower with a credit score of 752 who just started their current job is applying for a loan with payments equaling 19% of their income. Based on this classification tree, the best estimate of the probability that this loan applicant would default would beA) .000
B) .077
C) .253
D) .747
E) 1.000
Question
An automobile finance company analyzed a sample of recent automobile loans to try to determine key factors in identifying borrowers who would be likely to default on their auto loan. The response variable Default equals 1 if the borrower defaulted during the term of the loan and 0 otherwise. The predictor variable AutoDebt% was the ratio (expressed as a percent) of the required loan payments to the borrower's take-home income at the time of purchase. JobTime was the number of years the borrower had worked at their current job at the time of purchase. CredScore was the borrower's credit score at the time of purchase. Below is part of the classification tree the finance company derived from the data collected in the study. Assume they classify those with a default probability estimate of at least .5 as Defaulters.  A potential borrower with a credit score of 743 who has been at their current job for 3 years is applying for a loan with payments equaling 12% of their income. Based on this classification tree, the best estimate of the probability that this loan applicant would default would be
A) .000
B) .077
C) .123
D) .923
E) 1.000
A potential borrower with a credit score of 743 who has been at their current job for 3 years is applying for a loan with payments equaling 12% of their income. Based on this classification tree, the best estimate of the probability that this loan applicant would default would beA) .000
B) .077
C) .123
D) .923
E) 1.000
Question
An MBA admissions officer wishes to predict an MBA applicant's grade point average (GPA) for the MBA program on the basis of the applicant's score on the Graduate Management Admission Test (GMAT) and their undergraduate GPA (UGPA). The admissions officer used a random sample of previously admitted applicants to build a regression tree that can be used to predict the MBA GPAs of future MBA students. Below is the final regression tree.  Based on this regression tree, how many of the admitted applicants in the sample had a GMAT score of less than 650?
A) 96
B) 453
C) 507
D) 549
E) There is insufficient information to determine the answer.
Based on this regression tree, how many of the admitted applicants in the sample had a GMAT score of less than 650?A) 96
B) 453
C) 507
D) 549
E) There is insufficient information to determine the answer.
Question
An automobile finance company analyzed a sample of recent automobile loans to try to determine key factors in identifying borrowers who would be likely to default on their auto loan. The response variable Default equals 1 if the borrower defaulted during the term of the loan and 0 otherwise. The predictor variable AutoDebt% was the ratio (expressed as a percent) of the required loan payments to the borrower's take-home income at the time of purchase. JobTime was the number of years the borrower had worked at their current job at the time of purchase. CredScore was the borrower's credit score at the time of purchase. Below is part of the classification tree the finance company derived from the data collected in the study. Assume they classify those with a default probability estimate of at least .5 as Defaulters.  A potential borrower with a credit score of 523 who has been at their current job for 1 year is applying for a loan with payments equaling 17% of their income. Based on this classification tree, the best estimate of the probability that this loan applicant would default would be
A) .000
B) .239
C) .761
D) .867
E) 1.000
A potential borrower with a credit score of 523 who has been at their current job for 1 year is applying for a loan with payments equaling 17% of their income. Based on this classification tree, the best estimate of the probability that this loan applicant would default would beA) .000
B) .239
C) .761
D) .867
E) 1.000
Question
An automobile finance company analyzed a sample of recent automobile loans to try to determine key factors in identifying borrowers who would be likely to default on their auto loan. The response variable Default equals 1 if the borrower defaulted during the term of the loan and 0 otherwise. The predictor variable AutoDebt% was the ratio (expressed as a percent) of the required loan payments to the borrower's take-home income at the time of purchase. JobTime was the number of years the borrower had worked at their current job at the time of purchase. CredScore was the borrower's credit score at the time of purchase. Below is part of the classification tree the finance company derived from the data collected in the study. Assume they classify those with a default probability estimate of at least .5 as Defaulters. 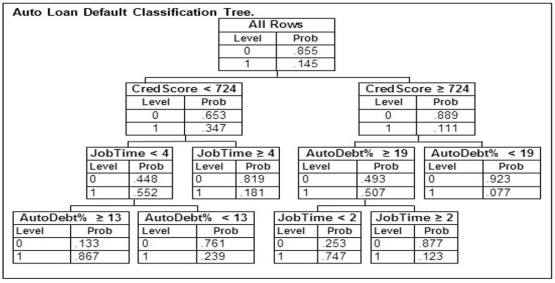 A potential borrower with a credit score of 503 who has been at their current job for 4 years and has a monthly income of $4,700 would like to apply for a loan. To be approved for the loan they would need to be classified as a non-Defaulter. Of the following monthly payments, which is the highest this loan could have to be approved for this potential borrower?
A) $481
B) $734
C) $1,295
D) None of these monthly payments would allow them to be classified as a non-Defaulter.
E) There is insufficient information to determine the maximum allowable monthly payment.
A potential borrower with a credit score of 503 who has been at their current job for 4 years and has a monthly income of $4,700 would like to apply for a loan. To be approved for the loan they would need to be classified as a non-Defaulter. Of the following monthly payments, which is the highest this loan could have to be approved for this potential borrower?A) $481
B) $734
C) $1,295
D) None of these monthly payments would allow them to be classified as a non-Defaulter.
E) There is insufficient information to determine the maximum allowable monthly payment.
Question
An automobile finance company analyzed a sample of recent automobile loans to try to determine key factors in identifying borrowers who would be likely to default on their auto loan. The response variable Default equals 1 if the borrower defaulted during the term of the loan and 0 otherwise. The predictor variable AutoDebt% was the ratio (expressed as a percent) of the required loan payments to the borrower's take-home income at the time of purchase. JobTime was the number of years the borrower had worked at their current job at the time of purchase. CredScore was the borrower's credit score at the time of purchase. Below is part of the classification tree the finance company derived from the data collected in the study. Assume they classify those with a default probability estimate of at least .5 as Defaulters.  A potential borrower with a credit score of 600 who has just started their current job with a monthly salary of $5,000 would like to apply for a loan. To be approved for the loan they would need to be classified as a non-Defaulter. Of the following monthly payments, which is the highest this loan could have to be approved for this potential borrower?
A) $595
B) $674
C) $795
D) None of these monthly payments would allow them to be classified as a non-Defaulter.
E) There is insufficient information to determine the maximum allowable monthly payment.
A potential borrower with a credit score of 600 who has just started their current job with a monthly salary of $5,000 would like to apply for a loan. To be approved for the loan they would need to be classified as a non-Defaulter. Of the following monthly payments, which is the highest this loan could have to be approved for this potential borrower?A) $595
B) $674
C) $795
D) None of these monthly payments would allow them to be classified as a non-Defaulter.
E) There is insufficient information to determine the maximum allowable monthly payment.
Question
An MBA admissions officer wishes to predict an MBA applicant's grade point average (GPA) for the MBA program on the basis of the applicant's score on the Graduate Management Admission Test (GMAT) and their undergraduate GPA (UGPA). The admissions officer used a random sample of previously admitted applicants to build a regression tree that can be used to predict the MBA GPAs of future MBA students. Below is the final regression tree.  Based on this regression tree, how many of the admitted applicants in the sample had a GMAT score of at least 740?
A) 129
B) 252
C) 381
D) 510
E) There is insufficient information to determine the answer.
Based on this regression tree, how many of the admitted applicants in the sample had a GMAT score of at least 740?A) 129
B) 252
C) 381
D) 510
E) There is insufficient information to determine the answer.
Question
An MBA admissions officer wishes to predict an MBA applicant's grade point average (GPA) for the MBA program on the basis of the applicant's score on the Graduate Management Admission Test (GMAT) and their undergraduate GPA (UGPA). The admissions officer used a random sample of previously admitted applicants to build a regression tree that can be used to predict the MBA GPAs of future MBA students. Below is the final regression tree.  Based on this regression tree, what proportion of the admitted applicants in the sample had both a GMAT score of at least 740 and an undergraduate GPA of at least 3.87?
A) .512
B) .339
C) .254
D) .122
E) There is insufficient information to determine the answer.
Based on this regression tree, what proportion of the admitted applicants in the sample had both a GMAT score of at least 740 and an undergraduate GPA of at least 3.87?A) .512
B) .339
C) .254
D) .122
E) There is insufficient information to determine the answer.
Question
An automobile finance company analyzed a sample of recent automobile loans to try to determine key factors in identifying borrowers who would be likely to default on their auto loan. The response variable Default equals 1 if the borrower defaulted during the term of the loan and 0 otherwise. The predictor variable AutoDebt% was the ratio (expressed as a percent) of the required loan payments to the borrower's take-home income at the time of purchase. JobTime was the number of years the borrower had worked at their current job at the time of purchase. CredScore was the borrower's credit score at the time of purchase. Below is part of the classification tree the finance company derived from the data collected in the study. Assume they classify those with a default probability estimate of at least .5 as Defaulters.  A potential borrower who has been at their current job for 16 years would like to apply for a loan. To be approved for the loan they would need to be classified as a non-Defaulter. Of the following credit scores, which is the lowest this potential borrower could have to be approved for the loan?
A) 421
B) 724
C) 795
D) There is no credit score which would allow them to be classified as a non-Defaulter.
E) There is insufficient information to determine the minimum allowable credit score.
A potential borrower who has been at their current job for 16 years would like to apply for a loan. To be approved for the loan they would need to be classified as a non-Defaulter. Of the following credit scores, which is the lowest this potential borrower could have to be approved for the loan?A) 421
B) 724
C) 795
D) There is no credit score which would allow them to be classified as a non-Defaulter.
E) There is insufficient information to determine the minimum allowable credit score.
Question
An automobile finance company analyzed a sample of recent automobile loans to try to determine key factors in identifying borrowers who would be likely to default on their auto loan. The response variable Default equals 1 if the borrower defaulted during the term of the loan and 0 otherwise. The predictor variable AutoDebt% was the ratio (expressed as a percent) of the required loan payments to the borrower's take-home income at the time of purchase. JobTime was the number of years the borrower had worked at their current job at the time of purchase. CredScore was the borrower's credit score at the time of purchase. Below is part of the classification tree the finance company derived from the data collected in the study. Assume they classify those with a default probability estimate of at least .5 as Defaulters.  A potential borrower with a credit score of 717 who has been at their current job for 3 years is considering applying for a loan. They do not yet have a particular loan amount in mind. Based on this classification tree, the best estimate that this loan applicant would default would be ________.
A) .000
B) .347
C) .552
D) .867
E) 1.000
A potential borrower with a credit score of 717 who has been at their current job for 3 years is considering applying for a loan. They do not yet have a particular loan amount in mind. Based on this classification tree, the best estimate that this loan applicant would default would be ________.A) .000
B) .347
C) .552
D) .867
E) 1.000
Question
An automobile finance company analyzed a sample of recent automobile loans to try to determine key factors in identifying borrowers who would be likely to default on their auto loan. The response variable Default equals 1 if the borrower defaulted during the term of the loan and 0 otherwise. The predictor variable AutoDebt% was the ratio (expressed as a percent) of the required loan payments to the borrower's take-home income at the time of purchase. JobTime was the number of years the borrower had worked at their current job at the time of purchase. CredScore was the borrower's credit score at the time of purchase. Below is part of the classification tree the finance company derived from the data collected in the study. Assume they classify those with a default probability estimate of at least .5 as Defaulters.  A potential borrower with a credit score of 812 and a monthly income of $4,000 would like to apply for a loan. To be approved for the loan they would need to be classified as a non-Defaulter. Of the following monthly payments, which is the highest this loan could have to be approved for this potential borrower?
A) $481
B) $634
C) $995
D) None of these monthly payments would allow them to be classified as a non-Defaulter.
E) There is insufficient information to determine the maximum allowable monthly payment.
A potential borrower with a credit score of 812 and a monthly income of $4,000 would like to apply for a loan. To be approved for the loan they would need to be classified as a non-Defaulter. Of the following monthly payments, which is the highest this loan could have to be approved for this potential borrower?A) $481
B) $634
C) $995
D) None of these monthly payments would allow them to be classified as a non-Defaulter.
E) There is insufficient information to determine the maximum allowable monthly payment.

Unlock Deck
Sign up to unlock the cards in this deck!
Unlock Deck
Unlock Deck
1/101
Play
Full screen (f)
Deck 5: Predictive Analytics I: Trees, K-Nearest Neighbors, Naive Bayes,
1
For a sufficiently large value of k, the k-nearest neighbors classification approach will always result in a lower misclassification rate than the simple branch splitting approach of the classification tree.
False
2
A quantitative variable which can have only the values of zero (0) or one (1) and which is used to represent a qualitative variable is known as a (1, 0) dummy variable.
True
3
To predict a qualitative, or categorical, response variable we could use a classification tree.
True
4
The optimal value of k to use for the k-nearest neighbors approach to predicting a quantitative response variable is the value of k that minimizes RMSE (the square root of the mean of the squared deviations of the predicted values from the observed values).
Unlock Deck
Unlock for access to all 101 flashcards in this deck.
Unlock Deck
k this deck
5
To predict a quantitative response variable, we could use a regression tree.
Unlock Deck
Unlock for access to all 101 flashcards in this deck.
Unlock Deck
k this deck
6
Naive Bayes' Theorem assumes that the events that the predictor variables take on the values x1, x2, …, xk are highly correlated for observations that fall into the particular category and statistically independent for observations that do not fall into the particular category.
Unlock Deck
Unlock for access to all 101 flashcards in this deck.
Unlock Deck
k this deck
7
Because different trust levels may be appropriate for different techniques, ensemble estimates may use a weighted average of the different results given by the different techniques.
Unlock Deck
Unlock for access to all 101 flashcards in this deck.
Unlock Deck
k this deck
8
The process of assigning items to prespecified categories is known as classification.
Unlock Deck
Unlock for access to all 101 flashcards in this deck.
Unlock Deck
k this deck
9
The confusion matrix for a classification tree shows which combinations of predictor variables cannot be used to predict the response variable.
Unlock Deck
Unlock for access to all 101 flashcards in this deck.
Unlock Deck
k this deck
10
The confusion matrix shows the number of observed response variables which are classified correctly.
Unlock Deck
Unlock for access to all 101 flashcards in this deck.
Unlock Deck
k this deck
11
One approach to avoid overfitting a classification tree is to use a validation data set to identify valid splits and a training data set to train the classification tree on when to stop making splits.
Unlock Deck
Unlock for access to all 101 flashcards in this deck.
Unlock Deck
k this deck
12
To "overfit" the data is to adjust the data until it matches our desired classification tree.
Unlock Deck
Unlock for access to all 101 flashcards in this deck.
Unlock Deck
k this deck
13
Because different classification techniques will perform better for different data sets, ensemble models consider multiple classification techniques before selecting the best classification technique to use for a particular data set.
Unlock Deck
Unlock for access to all 101 flashcards in this deck.
Unlock Deck
k this deck
14
The confusion matrix shows the number of observed response variables which are inaccurately classified.
Unlock Deck
Unlock for access to all 101 flashcards in this deck.
Unlock Deck
k this deck
15
A regression tree is used for predicting a qualitative response variable.
Unlock Deck
Unlock for access to all 101 flashcards in this deck.
Unlock Deck
k this deck
16
Classification involves identifying common traits in items in order to develop broad classes into which the items may be grouped based on those traits.
Unlock Deck
Unlock for access to all 101 flashcards in this deck.
Unlock Deck
k this deck
17
The nearest neighbors to an observation are determined by measuring the distance between the set of predictor variables for that observation and the set of predictor variables for every other observation.
Unlock Deck
Unlock for access to all 101 flashcards in this deck.
Unlock Deck
k this deck
18
The best value of k to use for the k-nearest neighbors approach to classifying a qualitative response variable is the largest value of k for which all distances between neighbors is less than some prespecified distance.
Unlock Deck
Unlock for access to all 101 flashcards in this deck.
Unlock Deck
k this deck
19
The confusion matrix is not a good indicator of a classification tree's accuracy.
Unlock Deck
Unlock for access to all 101 flashcards in this deck.
Unlock Deck
k this deck
20
A classification tree is useful for predicting a quantitative response variable.
Unlock Deck
Unlock for access to all 101 flashcards in this deck.
Unlock Deck
k this deck
21
Suppose that a bank wishes to predict whether or not an existing holder of its Silver credit card will upgrade, for an annual fee, to its Platinum credit card. To do this, the bank carries out a pilot study that randomly selects 40 of its existing Silver card holders and offers each Silver card holder an upgrade to its Platinum card. Here, the response variable Upgrade equals 1 if the Silver card holder decided to upgrade and 0 otherwise. Moreover, the predictor variable Purchases is last year's purchases (in thousands of dollars) by the Silver card holder, and the predictor variable PlatProfile equals 1 if the Silver card holder conforms to the bank's Platinum profile and 0 otherwise. Below is the classification tree they derived from the data collected in the study. Of these 40 Silver card holders, what is the proportion that did not upgrade?
A) .5535
B) .5250
C) .4750
D) .1179
E) .1000
Of these 40 Silver card holders, what is the proportion that did not upgrade?A) .5535
B) .5250
C) .4750
D) .1179
E) .1000
Unlock Deck
Unlock for access to all 101 flashcards in this deck.
Unlock Deck
k this deck
22
Suppose that a bank wishes to predict whether or not an existing holder of its Silver credit card will upgrade, for an annual fee, to its Platinum credit card. To do this, the bank carries out a pilot study that randomly selects 40 of its existing Silver card holders and offers each Silver card holder an upgrade to its Platinum card. Here, the response variable Upgrade equals 1 if the Silver card holder decided to upgrade and 0 otherwise. Moreover, the predictor variable Purchases is last year's purchases (in thousands of dollars) by the Silver card holder, and the predictor variable PlatProfile equals 1 if the Silver card holder conforms to the bank's Platinum profile and 0 otherwise. Below is the classification tree they derived from the data collected in the study. Based on this classification tree, which of the following Silver card holders would the bank classify as a non-upgrader (assuming they classify those with an upgrade probability estimate of at least .5 as upgraders)?
A) PlatProfile(1) & Purchases = 31.50
B) PlatProfile(1) & Purchases = 39.55
C) Purchases = 18.25
D) Purchases = 34.99
E) PlatProfile(0) & Purchases = 49.80
Based on this classification tree, which of the following Silver card holders would the bank classify as a non-upgrader (assuming they classify those with an upgrade probability estimate of at least .5 as upgraders)?A) PlatProfile(1) & Purchases = 31.50
B) PlatProfile(1) & Purchases = 39.55
C) Purchases = 18.25
D) Purchases = 34.99
E) PlatProfile(0) & Purchases = 49.80
Unlock Deck
Unlock for access to all 101 flashcards in this deck.
Unlock Deck
k this deck
23
Unlike a classification tree, a regression tree enables us to predict the value of a ________ response variable.
A) quantitative
B) categorical
C) qualitative
D) class membership
A) quantitative
B) categorical
C) qualitative
D) class membership
Unlock Deck
Unlock for access to all 101 flashcards in this deck.
Unlock Deck
k this deck
24
An internet service provider (ISP) has randomly selected a sample of 223 observations concerning values of the response variable Churn and several predictor variables based on customer activity during the most recently billed month. Here Churn equals Yes if a customer churned-left the internet service provider for another ISP-and equals No otherwise. The predictor variable MinutesOn is the average daily minutes the customer spent online. EmailSent is the average daily number of emails the customer sent from the email address provided by the ISP. ServCalls is the number of times the customer called for service. Below is part of the classification tree they derived from the data collected in the study. Of the sampled customers who spent an average of at least 511 minutes online per day and sent an average of fewer than 7 emails per day from their ISP-provided email address, how many churned?
A) 7
B) 8
C) 9
D) 14
E) 32
Of the sampled customers who spent an average of at least 511 minutes online per day and sent an average of fewer than 7 emails per day from their ISP-provided email address, how many churned?A) 7
B) 8
C) 9
D) 14
E) 32
Unlock Deck
Unlock for access to all 101 flashcards in this deck.
Unlock Deck
k this deck
25
An internet service provider (ISP) has randomly selected a sample of 223 observations concerning values of the response variable Churn and several predictor variables based on customer activity during the most recently billed month. Here Churn equals Yes if a customer churned-left the internet service provider for another ISP-and equals No otherwise. The predictor variable MinutesOn is the average daily minutes the customer spent online. EmailSent is the average daily number of emails the customer sent from the email address provided by the ISP. ServCalls is the number of times the customer called for service. Below is part of the classification tree they derived from the data collected in the study. Of the sampled customers who spent an average of at least 511 minutes online per day, how many sent an average of at least 7 emails per day from their ISP-provided email address?
A) 14
B) 9
C) 7
D) 5
E) 2
Of the sampled customers who spent an average of at least 511 minutes online per day, how many sent an average of at least 7 emails per day from their ISP-provided email address?A) 14
B) 9
C) 7
D) 5
E) 2
Unlock Deck
Unlock for access to all 101 flashcards in this deck.
Unlock Deck
k this deck
26
Which of the following possible response variables is most appropriate to predict using a regression tree?
A) political party preference of a registered voter
B) rate of return on an investment
C) option(s) a new car buyer will select
D) which borrower(s) will default on a loan
E) whether or not a fitness center member will renew their membership
A) political party preference of a registered voter
B) rate of return on an investment
C) option(s) a new car buyer will select
D) which borrower(s) will default on a loan
E) whether or not a fitness center member will renew their membership
Unlock Deck
Unlock for access to all 101 flashcards in this deck.
Unlock Deck
k this deck
27
An internet service provider (ISP) has randomly selected a sample of 223 observations concerning values of the response variable Churn and several predictor variables based on customer activity during the most recently billed month. Here Churn equals Yes if a customer churned-left the internet service provider for another ISP-and equals No otherwise. The predictor variable MinutesOn is the average daily minutes the customer spent online. EmailSent is the average daily number of emails the customer sent from the email address provided by the ISP. ServCalls is the number of times the customer called for service. Below is part of the classification tree they derived from the data collected in the study. Of the sampled customers who spent an average of less than 511 minutes online per day and placed fewer than 3 service calls, what is the sample proportion of those who churned?
A) .067
B) .078
C) .529
D) .861
E) .885
Of the sampled customers who spent an average of less than 511 minutes online per day and placed fewer than 3 service calls, what is the sample proportion of those who churned?A) .067
B) .078
C) .529
D) .861
E) .885
Unlock Deck
Unlock for access to all 101 flashcards in this deck.
Unlock Deck
k this deck
28
The k-nearest neighbors approach can be used to predict
A) only qualitative response variables based on predictor variables.
B) only quantitative response variables based on predictor variables.
C) neither qualitative nor quantitative response variables; only predictor variables.
D) both qualitative and quantitative response variables based on predictor variables.
Unlock Deck
Unlock for access to all 101 flashcards in this deck.
Unlock Deck
k this deck
29
The naive Bayes' classification procedure can be used to predict
A) only qualitative response variables based on predictor variables.
B) only quantitative response variables based on predictor variables.
C) neither qualitative nor quantitative response variables; only predictor variables.
D) both qualitative and quantitative response variables based on predictor variables.
Unlock Deck
Unlock for access to all 101 flashcards in this deck.
Unlock Deck
k this deck
30
Suppose that a bank wishes to predict whether or not an existing holder of its Silver credit card will upgrade, for an annual fee, to its Platinum credit card. To do this, the bank carries out a pilot study that randomly selects 40 of its existing Silver card holders and offers each Silver card holder an upgrade to its Platinum card. Here, the response variable Upgrade equals 1 if the Silver card holder decided to upgrade and 0 otherwise. Moreover, the predictor variable Purchases is last year's purchases (in thousands of dollars) by the Silver card holder, and the predictor variable PlatProfile equals 1 if the Silver card holder conforms to the bank's Platinum profile and 0 otherwise. Below is the classification tree they derived from the data collected in the study. Assume they classify those with an upgrade probability estimate of at least .5 as upgraders. Based on this classification tree, a member of the study sample who made $28,520 in purchases last year and conformed to the bank's Platinum profile but did not upgrade to the Platinum card would be…
A) accurately classified as an upgrader.
B) accurately classified as a non-upgrader.
C) inaccurately classified as an upgrader.
D) inaccurately classified as a non-upgrader.
Assume they classify those with an upgrade probability estimate of at least .5 as upgraders. Based on this classification tree, a member of the study sample who made $28,520 in purchases last year and conformed to the bank's Platinum profile but did not upgrade to the Platinum card would be…A) accurately classified as an upgrader.
B) accurately classified as a non-upgrader.
C) inaccurately classified as an upgrader.
D) inaccurately classified as a non-upgrader.
Unlock Deck
Unlock for access to all 101 flashcards in this deck.
Unlock Deck
k this deck
31
Dividing the entire data set into a training data set and a validation training set is a key step in one approach to ________ the data.
A) declassifying
B) purifying
C) removing invalid observations from
D) training
E) avoid overfitting
A) declassifying
B) purifying
C) removing invalid observations from
D) training
E) avoid overfitting
Unlock Deck
Unlock for access to all 101 flashcards in this deck.
Unlock Deck
k this deck
32
An internet service provider (ISP) has randomly selected a sample of 223 observations concerning values of the response variable Churn and several predictor variables based on customer activity during the most recently billed month. Here Churn equals Yes if a customer churned-left the internet service provider for another ISP-and equals No otherwise. The predictor variable MinutesOn is the average daily minutes the customer spent online. EmailSent is the average daily number of emails the customer sent from the email address provided by the ISP. ServCalls is the number of times the customer called for service. Below is part of the classification tree they derived from the data collected in the study. Of the sampled customers who spent an average of at least 511 minutes online per day and sent an average of fewer than 7 emails per day from their ISP-provided email address, what is the sample proportion of those who churned?
A) .078
B) .527
C) .571
D) .778
E) .885
Of the sampled customers who spent an average of at least 511 minutes online per day and sent an average of fewer than 7 emails per day from their ISP-provided email address, what is the sample proportion of those who churned?A) .078
B) .527
C) .571
D) .778
E) .885
Unlock Deck
Unlock for access to all 101 flashcards in this deck.
Unlock Deck
k this deck
33
Combining the estimates or predictions obtained from different analytics to arrive at an overall result is done by developing a(n) ________.
A) classification tree
B) regression tree
C) k-nearest neighbors model
D) naive Bayes' classification
E) ensemble model.
A) classification tree
B) regression tree
C) k-nearest neighbors model
D) naive Bayes' classification
E) ensemble model.
Unlock Deck
Unlock for access to all 101 flashcards in this deck.
Unlock Deck
k this deck
34
Suppose that a bank wishes to predict whether or not an existing holder of its Silver credit card will upgrade, for an annual fee, to its Platinum credit card. To do this, the bank carries out a pilot study that randomly selects 40 of its existing Silver card holders and offers each Silver card holder an upgrade to its Platinum card. Here, the response variable Upgrade equals 1 if the Silver card holder decided to upgrade and 0 otherwise. Moreover, the predictor variable Purchases is last year's purchases (in thousands of dollars) by the Silver card holder, and the predictor variable PlatProfile equals 1 if the Silver card holder conforms to the bank's Platinum profile and 0 otherwise. Below is the classification tree they derived from the data collected in the study. Assume they classify those with an upgrade probability estimate of at least .5 as upgraders. Based on this classification tree, a member of the study sample who made $50,450 in purchases last year, did not conform to the bank's Platinum profile, and upgraded to the Platinum card would be…
A) accurately classified as an upgrader.
B) accurately classified as a non-upgrader.
C) inaccurately classified as an upgrader.
D) inaccurately classified as a non-upgrader.
Assume they classify those with an upgrade probability estimate of at least .5 as upgraders. Based on this classification tree, a member of the study sample who made $50,450 in purchases last year, did not conform to the bank's Platinum profile, and upgraded to the Platinum card would be…A) accurately classified as an upgrader.
B) accurately classified as a non-upgrader.
C) inaccurately classified as an upgrader.
D) inaccurately classified as a non-upgrader.
Unlock Deck
Unlock for access to all 101 flashcards in this deck.
Unlock Deck
k this deck
35
Which of the following possible response variables is most appropriate to predict using a classification tree?
A) annual product demand
B) weekly natural gas consumption
C) grade point average
D) annual amount charged (in $) by a credit card holder
E) whether or not a discount club member will renew their membership
A) annual product demand
B) weekly natural gas consumption
C) grade point average
D) annual amount charged (in $) by a credit card holder
E) whether or not a discount club member will renew their membership
Unlock Deck
Unlock for access to all 101 flashcards in this deck.
Unlock Deck
k this deck
36
Which of the following possible response variables is most appropriate to predict using a classification tree?
A) annual earnings of a salesperson on commission
B) whether or not an applicant will accept a job offer
C) score a student will earn on a 100-point exam
D) value of a share of stock for a corporation
A) annual earnings of a salesperson on commission
B) whether or not an applicant will accept a job offer
C) score a student will earn on a 100-point exam
D) value of a share of stock for a corporation
Unlock Deck
Unlock for access to all 101 flashcards in this deck.
Unlock Deck
k this deck
37
An internet service provider (ISP) has randomly selected a sample of 223 observations concerning values of the response variable Churn and several predictor variables based on customer activity during the most recently billed month. Here Churn equals Yes if a customer churned-left the internet service provider for another ISP-and equals No otherwise. The predictor variable MinutesOn is the average daily minutes the customer spent online. EmailSent is the average daily number of emails the customer sent from the email address provided by the ISP. ServCalls is the number of times the customer called for service. Below is part of the classification tree they derived from the data collected in the study. Of the 223 sampled customers, what is the sample proportion of those who churned?
A) .143
B) .168
C) .571
D) .857
E) .885
Of the 223 sampled customers, what is the sample proportion of those who churned?A) .143
B) .168
C) .571
D) .857
E) .885
Unlock Deck
Unlock for access to all 101 flashcards in this deck.
Unlock Deck
k this deck
38
Suppose that a bank wishes to predict whether or not an existing holder of its Silver credit card will upgrade, for an annual fee, to its Platinum credit card. To do this, the bank carries out a pilot study that randomly selects 40 of its existing Silver card holders and offers each Silver card holder an upgrade to its Platinum card. Here, the response variable Upgrade equals 1 if the Silver card holder decided to upgrade and 0 otherwise. Moreover, the predictor variable Purchases is last year's purchases (in thousands of dollars) by the Silver card holder, and the predictor variable PlatProfile equals 1 if the Silver card holder conforms to the bank's Platinum profile and 0 otherwise. Below is the classification tree they derived from the data collected in the study. Based on this classification tree, which of the following Silver card holders would the bank classify as an upgrader (assuming they classify those with an upgrade probability estimate of at least .5 as upgraders)?
A) PlatProfile(0) & Purchases = 31.50
B) PlatProfile(1)
C) Purchases = 48.25
D) Purchases = 34.99
E) PlatProfile(0) & Purchases = 34.75
Based on this classification tree, which of the following Silver card holders would the bank classify as an upgrader (assuming they classify those with an upgrade probability estimate of at least .5 as upgraders)?A) PlatProfile(0) & Purchases = 31.50
B) PlatProfile(1)
C) Purchases = 48.25
D) Purchases = 34.99
E) PlatProfile(0) & Purchases = 34.75
Unlock Deck
Unlock for access to all 101 flashcards in this deck.
Unlock Deck
k this deck
39
Which of the following possible response variables is most appropriate to predict using a regression tree?
A) whether or not a passport holder will travel abroad in the next year.
B) color of carpet a new-home buyer will select.
C) which admitted students will attend a university.
D) monthly sales of used cars.
A) whether or not a passport holder will travel abroad in the next year.
B) color of carpet a new-home buyer will select.
C) which admitted students will attend a university.
D) monthly sales of used cars.
Unlock Deck
Unlock for access to all 101 flashcards in this deck.
Unlock Deck
k this deck
40
Which of the following would you find on a classification tree?
A) roots
B) bark
C) a twig
D) a leaf
A) roots
B) bark
C) a twig
D) a leaf
Unlock Deck
Unlock for access to all 101 flashcards in this deck.
Unlock Deck
k this deck
41
An automobile finance company analyzed a sample of recent automobile loans to try to determine key factors in identifying borrowers who would be likely to default on their auto loan. The response variable Default equals 1 if the borrower defaulted during the term of the loan and 0 otherwise. The predictor variable AutoDebt% was the ratio (expressed as a percent) of the required loan payments to the borrower's take-home income at the time of purchase. JobTime was the number of years the borrower had worked at their current job at the time of purchase. CredScore was the borrower's credit score at the time of purchase. Below is part of the classification tree the finance company derived from the data collected in the study. Assume they classify those with a default probability estimate of at least .5 as Defaulters. Based on this classification tree, a member of the study sample who had a credit score of 724, been at their current job for 2 years, took out a loan with payments equaling 20% of their income, and did not default would be
A) inaccurately classified as a Defaulter.
B) inaccurately classified as a non-Defaulter.
C) accurately classified as a Defaulter.
D) accurately classified as a non-Defaulter.
Based on this classification tree, a member of the study sample who had a credit score of 724, been at their current job for 2 years, took out a loan with payments equaling 20% of their income, and did not default would beA) inaccurately classified as a Defaulter.
B) inaccurately classified as a non-Defaulter.
C) accurately classified as a Defaulter.
D) accurately classified as a non-Defaulter.
Unlock Deck
Unlock for access to all 101 flashcards in this deck.
Unlock Deck
k this deck
42
An internet service provider (ISP) has randomly selected a sample of 223 observations concerning values of the response variable Churn and several predictor variables based on customer activity during the most recently billed month. Here Churn equals Yes if a customer churned-left the internet service provider for another ISP-and equals No otherwise. The predictor variable MinutesOn is the average daily minutes the customer spent online. EmailSent is the average daily number of emails the customer sent from the email address provided by the ISP. ServCalls is the number of times the customer called for service. Below is part of the classification tree they derived from the data collected in the study. Of the sampled customers who spent an average of at least 511 minutes online per day and sent an average of at least 7 emails per day from their ISP-provided email address, how many did not churn?
A) 4
B) 6
C) 7
D) 9
E) 2
Of the sampled customers who spent an average of at least 511 minutes online per day and sent an average of at least 7 emails per day from their ISP-provided email address, how many did not churn?A) 4
B) 6
C) 7
D) 9
E) 2
Unlock Deck
Unlock for access to all 101 flashcards in this deck.
Unlock Deck
k this deck
43
An automobile finance company analyzed a sample of recent automobile loans to try to determine key factors in identifying borrowers who would be likely to default on their auto loan. The response variable Default equals 1 if the borrower defaulted during the term of the loan and 0 otherwise. The predictor variable AutoDebt% was the ratio (expressed as a percent) of the required loan payments to the borrower's take-home income at the time of purchase. JobTime was the number of years the borrower had worked at their current job at the time of purchase. CredScore was the borrower's credit score at the time of purchase. Below is part of the classification tree the finance company derived from the data collected in the study. Assume they classify those with a default probability estimate of at least .5 as Defaulters. Based on this classification tree, a member of the study sample who had a credit score of 698, had just started a new job, took out a loan with payments equaling 7% of their income, and defaulted would be
A) inaccurately classified as a Defaulter.
B) inaccurately classified as a non-Defaulter.
C) accurately classified as a Defaulter.
D) accurately classified as a non-Defaulter.
Based on this classification tree, a member of the study sample who had a credit score of 698, had just started a new job, took out a loan with payments equaling 7% of their income, and defaulted would beA) inaccurately classified as a Defaulter.
B) inaccurately classified as a non-Defaulter.
C) accurately classified as a Defaulter.
D) accurately classified as a non-Defaulter.
Unlock Deck
Unlock for access to all 101 flashcards in this deck.
Unlock Deck
k this deck
44
An automobile finance company analyzed a sample of recent automobile loans to try to determine key factors in identifying borrowers who would be likely to default on their auto loan. The response variable Default equals 1 if the borrower defaulted during the term of the loan and 0 otherwise. The predictor variable AutoDebt% was the ratio (expressed as a percent) of the required loan payments to the borrower's take-home income at the time of purchase. JobTime was the number of years the borrower had worked at their current job at the time of purchase. CredScore was the borrower's credit score at the time of purchase. Below is part of the classification tree the finance company derived from the data collected in the study. Assume they classify those with a default probability estimate of at least .5 as Defaulters. Based on this classification tree, a member of the study sample who had a credit score of 423, been at their current job for 4 years, took out a loan with payments equaling 22% of their income, and did not default would be
A) inaccurately classified as a Defaulter.
B) inaccurately classified as a non-Defaulter.
C) accurately classified as a Defaulter.
D) accurately classified as a non-Defaulter.
Based on this classification tree, a member of the study sample who had a credit score of 423, been at their current job for 4 years, took out a loan with payments equaling 22% of their income, and did not default would beA) inaccurately classified as a Defaulter.
B) inaccurately classified as a non-Defaulter.
C) accurately classified as a Defaulter.
D) accurately classified as a non-Defaulter.
Unlock Deck
Unlock for access to all 101 flashcards in this deck.
Unlock Deck
k this deck
45
An automobile finance company analyzed a sample of recent automobile loans to try to determine key factors in identifying borrowers who would be likely to default on their auto loan. The response variable Default equals 1 if the borrower defaulted during the term of the loan and 0 otherwise. The predictor variable AutoDebt% was the ratio (expressed as a percent) of the required loan payments to the borrower's take-home income at the time of purchase. JobTime was the number of years the borrower had worked at their current job at the time of purchase. CredScore was the borrower's credit score at the time of purchase. Below is part of the classification tree the finance company derived from the data collected in the study. Assume they classify those with a default probability estimate of at least .5 as Defaulters. Based on this classification tree, a member of the study sample who had a credit score of 819, been at their current job for 3 years, took out a loan with payments equaling 15% of their income, and did not default would be
A) inaccurately classified as a Defaulter.
B) inaccurately classified as a non-Defaulter.
C) accurately classified as a Defaulter.
D) accurately classified as a non-Defaulter.
Based on this classification tree, a member of the study sample who had a credit score of 819, been at their current job for 3 years, took out a loan with payments equaling 15% of their income, and did not default would beA) inaccurately classified as a Defaulter.
B) inaccurately classified as a non-Defaulter.
C) accurately classified as a Defaulter.
D) accurately classified as a non-Defaulter.
Unlock Deck
Unlock for access to all 101 flashcards in this deck.
Unlock Deck
k this deck
46
An automobile finance company analyzed a sample of recent automobile loans to try to determine key factors in identifying borrowers who would be likely to default on their auto loan. The response variable Default equals 1 if the borrower defaulted during the term of the loan and 0 otherwise. The predictor variable AutoDebt% was the ratio (expressed as a percent) of the required loan payments to the borrower's take-home income at the time of purchase. JobTime was the number of years the borrower had worked at their current job at the time of purchase. CredScore was the borrower's credit score at the time of purchase. Below is part of the classification tree the finance company derived from the data collected in the study. Assume they classify those with a default probability estimate of at least .5 as Defaulters. Based on this classification tree, a member of the study sample who had a credit score of 523, been at their current job for 1 year, took out a loan with payments equaling 17% of their income, and defaulted would be
A) inaccurately classified as a Defaulter.
B) inaccurately classified as a non-Defaulter.
C) accurately classified as a Defaulter.
D) accurately classified as a non-Defaulter.
Based on this classification tree, a member of the study sample who had a credit score of 523, been at their current job for 1 year, took out a loan with payments equaling 17% of their income, and defaulted would beA) inaccurately classified as a Defaulter.
B) inaccurately classified as a non-Defaulter.
C) accurately classified as a Defaulter.
D) accurately classified as a non-Defaulter.
Unlock Deck
Unlock for access to all 101 flashcards in this deck.
Unlock Deck
k this deck
47
An automobile finance company analyzed a sample of recent automobile loans to try to determine key factors in identifying borrowers who would be likely to default on their auto loan. The response variable Default equals 1 if the borrower defaulted during the term of the loan and 0 otherwise. The predictor variable AutoDebt% was the ratio (expressed as a percent) of the required loan payments to the borrower's take-home income at the time of purchase. JobTime was the number of years the borrower had worked at their current job at the time of purchase. CredScore was the borrower's credit score at the time of purchase. Below is part of the classification tree the finance company derived from the data collected in the study. Assume they classify those with a default probability estimate of at least .5 as Defaulters. Based on this classification tree, a member of the study sample who had a credit score of 667, been at their current job for 3 years, took out a loan with payments equaling 13% of their income, and did not default would be
A) inaccurately classified as a Defaulter.
B) inaccurately classified as a non-Defaulter.
C) accurately classified as a Defaulter.
D) accurately classified as a non-Defaulter.
Based on this classification tree, a member of the study sample who had a credit score of 667, been at their current job for 3 years, took out a loan with payments equaling 13% of their income, and did not default would beA) inaccurately classified as a Defaulter.
B) inaccurately classified as a non-Defaulter.
C) accurately classified as a Defaulter.
D) accurately classified as a non-Defaulter.
Unlock Deck
Unlock for access to all 101 flashcards in this deck.
Unlock Deck
k this deck
48
An internet service provider (ISP) has randomly selected a sample of 223 observations concerning values of the response variable Churn and several predictor variables based on customer activity during the most recently billed month. Here Churn equals Yes if a customer churned-left the internet service provider for another ISP-and equals No otherwise. The predictor variable MinutesOn is the average daily minutes the customer spent online. EmailSent is the average daily number of emails the customer sent from the email address provided by the ISP. ServCalls is the number of times the customer called for service. Below is part of the classification tree they derived from the data collected in the study. Of the sampled customers who spent an average of at least 511 minutes online per day and sent an average of less than 7 emails per day from their ISP-provided email address, what is the sample proportion of those who did not churn?
A) .078
B) .143
C) .200
D) .211
E) .222
Of the sampled customers who spent an average of at least 511 minutes online per day and sent an average of less than 7 emails per day from their ISP-provided email address, what is the sample proportion of those who did not churn?A) .078
B) .143
C) .200
D) .211
E) .222
Unlock Deck
Unlock for access to all 101 flashcards in this deck.
Unlock Deck
k this deck
49
An automobile finance company analyzed a sample of recent automobile loans to try to determine key factors in identifying borrowers who would be likely to default on their auto loan. The response variable Default equals 1 if the borrower defaulted during the term of the loan and 0 otherwise. The predictor variable AutoDebt% was the ratio (expressed as a percent) of the required loan payments to the borrower's take-home income at the time of purchase. JobTime was the number of years the borrower had worked at their current job at the time of purchase. CredScore was the borrower's credit score at the time of purchase. Below is part of the classification tree the finance company derived from the data collected in the study. Assume they classify those with a default probability estimate of at least .5 as Defaulters. Based on this classification tree, a member of the study sample who had a credit score of 774, just started their current job, took out a loan with payments equaling 19% of their income, and did not default would be
A) inaccurately classified as a Defaulter.
B) inaccurately classified as a non-Defaulter.
C) accurately classified as a Defaulter.
D) accurately classified as a non-Defaulter.
Based on this classification tree, a member of the study sample who had a credit score of 774, just started their current job, took out a loan with payments equaling 19% of their income, and did not default would beA) inaccurately classified as a Defaulter.
B) inaccurately classified as a non-Defaulter.
C) accurately classified as a Defaulter.
D) accurately classified as a non-Defaulter.
Unlock Deck
Unlock for access to all 101 flashcards in this deck.
Unlock Deck
k this deck
50
An automobile finance company analyzed a sample of recent automobile loans to try to determine key factors in identifying borrowers who would be likely to default on their auto loan. The response variable Default equals 1 if the borrower defaulted during the term of the loan and 0 otherwise. The predictor variable AutoDebt% was the ratio (expressed as a percent) of the required loan payments to the borrower's take-home income at the time of purchase. JobTime was the number of years the borrower had worked at their current job at the time of purchase. CredScore was the borrower's credit score at the time of purchase. Below is part of the classification tree the finance company derived from the data collected in the study. Assume they classify those with a default probability estimate of at least .5 as Defaulters. Based on this classification tree, a member of the study sample who had a credit score of 786, just started their current job, took out a loan with payments equaling 9% of their income, and defaulted would be
A) inaccurately classified as a Defaulter.
B) inaccurately classified as a non-Defaulter.
C) accurately classified as a Defaulter.
D) accurately classified as a non-Defaulter.
Based on this classification tree, a member of the study sample who had a credit score of 786, just started their current job, took out a loan with payments equaling 9% of their income, and defaulted would beA) inaccurately classified as a Defaulter.
B) inaccurately classified as a non-Defaulter.
C) accurately classified as a Defaulter.
D) accurately classified as a non-Defaulter.
Unlock Deck
Unlock for access to all 101 flashcards in this deck.
Unlock Deck
k this deck
51
An internet service provider (ISP) has randomly selected a sample of 223 observations concerning values of the response variable Churn and several predictor variables based on customer activity during the most recently billed month. Here Churn equals Yes if a customer churned-left the internet service provider for another ISP-and equals No otherwise. The predictor variable MinutesOn is the average daily minutes the customer spent online. EmailSent is the average daily number of emails the customer sent from the email address provided by the ISP. ServCalls is the number of times the customer called for service. Below is part of the classification tree they derived from the data collected in the study. Of the sampled customers who spent an average of at least 511 minutes online per day and sent an average of at least 7 emails per day from their ISP-provided email address, what is the sample proportion of those who did not churn?
A) .800
B) .778
C) .429
D) .222
E) .200
Of the sampled customers who spent an average of at least 511 minutes online per day and sent an average of at least 7 emails per day from their ISP-provided email address, what is the sample proportion of those who did not churn?A) .800
B) .778
C) .429
D) .222
E) .200
Unlock Deck
Unlock for access to all 101 flashcards in this deck.
Unlock Deck
k this deck
52
An internet service provider (ISP) has randomly selected a sample of 223 observations concerning values of the response variable Churn and several predictor variables based on customer activity during the most recently billed month. Here Churn equals Yes if a customer churned-left the internet service provider for another ISP-and equals No otherwise. The predictor variable MinutesOn is the average daily minutes the customer spent online. EmailSent is the average daily number of emails the customer sent from the email address provided by the ISP. ServCalls is the number of times the customer called for service. Below is part of the classification tree they derived from the data collected in the study. Of the sampled customers who spent an average of at least 511 minutes online per day, how many did not churn?
A) 14
B) 9
C) 7
D) 6
E) 5
Of the sampled customers who spent an average of at least 511 minutes online per day, how many did not churn?A) 14
B) 9
C) 7
D) 6
E) 5
Unlock Deck
Unlock for access to all 101 flashcards in this deck.
Unlock Deck
k this deck
53
An internet service provider (ISP) has randomly selected a sample of 223 observations concerning values of the response variable Churn and several predictor variables based on customer activity during the most recently billed month. Here Churn equals Yes if a customer churned-left the internet service provider for another ISP-and equals No otherwise. The predictor variable MinutesOn is the average daily minutes the customer spent online. EmailSent is the average daily number of emails the customer sent from the email address provided by the ISP. ServCalls is the number of times the customer called for service. Below is part of the classification tree they derived from the data collected in the study. Of the sampled customers who spent an average of less than 511 minutes online per day and placed at least 3 service calls, how many did not churn?
A) 7
B) 8
C) 9
D) 15
E) 17
Of the sampled customers who spent an average of less than 511 minutes online per day and placed at least 3 service calls, how many did not churn?A) 7
B) 8
C) 9
D) 15
E) 17
Unlock Deck
Unlock for access to all 101 flashcards in this deck.
Unlock Deck
k this deck
54
An internet service provider (ISP) has randomly selected a sample of 223 observations concerning values of the response variable Churn and several predictor variables based on customer activity during the most recently billed month. Here Churn equals Yes if a customer churned-left the internet service provider for another ISP-and equals No otherwise. The predictor variable MinutesOn is the average daily minutes the customer spent online. EmailSent is the average daily number of emails the customer sent from the email address provided by the ISP. ServCalls is the number of times the customer called for service. Below is part of the classification tree they derived from the data collected in the study. Of the 223 sampled customers, what is the sample proportion of those who did not churn?
A) .078
B) .143
C) .168
D) .571
E) .857
Of the 223 sampled customers, what is the sample proportion of those who did not churn?A) .078
B) .143
C) .168
D) .571
E) .857
Unlock Deck
Unlock for access to all 101 flashcards in this deck.
Unlock Deck
k this deck
55
An internet service provider (ISP) has randomly selected a sample of 223 observations concerning values of the response variable Churn and several predictor variables based on customer activity during the most recently billed month. Here Churn equals Yes if a customer churned-left the internet service provider for another ISP-and equals No otherwise. The predictor variable MinutesOn is the average daily minutes the customer spent online. EmailSent is the average daily number of emails the customer sent from the email address provided by the ISP. ServCalls is the number of times the customer called for service. Below is part of the classification tree they derived from the data collected in the study. Of the sampled customers who spent an average of at least 511 minutes online per day and sent an average of at least 7 emails per day from their ISP-provided email address, how many churned?
A) 9
B) 7
C) 5
D) 2
E) 1
Of the sampled customers who spent an average of at least 511 minutes online per day and sent an average of at least 7 emails per day from their ISP-provided email address, how many churned?A) 9
B) 7
C) 5
D) 2
E) 1
Unlock Deck
Unlock for access to all 101 flashcards in this deck.
Unlock Deck
k this deck
56
An internet service provider (ISP) has randomly selected a sample of 223 observations concerning values of the response variable Churn and several predictor variables based on customer activity during the most recently billed month. Here Churn equals Yes if a customer churned-left the internet service provider for another ISP-and equals No otherwise. The predictor variable MinutesOn is the average daily minutes the customer spent online. EmailSent is the average daily number of emails the customer sent from the email address provided by the ISP. ServCalls is the number of times the customer called for service. Below is part of the classification tree they derived from the data collected in the study. Of the sampled customers who spent an average of less than 511 minutes online per day and placed at least 3 service calls, what is the sample proportion of those who did not churn?
A) .078
B) .471
C) .529
D) .571
E) .922
Of the sampled customers who spent an average of less than 511 minutes online per day and placed at least 3 service calls, what is the sample proportion of those who did not churn?A) .078
B) .471
C) .529
D) .571
E) .922
Unlock Deck
Unlock for access to all 101 flashcards in this deck.
Unlock Deck
k this deck
57
An internet service provider (ISP) has randomly selected a sample of 223 observations concerning values of the response variable Churn and several predictor variables based on customer activity during the most recently billed month. Here Churn equals Yes if a customer churned-left the internet service provider for another ISP-and equals No otherwise. The predictor variable MinutesOn is the average daily minutes the customer spent online. EmailSent is the average daily number of emails the customer sent from the email address provided by the ISP. ServCalls is the number of times the customer called for service. Below is part of the classification tree they derived from the data collected in the study. Of the sampled customers who spent an average of at least 511 minutes online per day and sent an average of at least 7 emails per day from their ISP-provided email address, what is the sample proportion of those who churned?
A) .078
B) .143
C) .200
D) .571
E) .778
Of the sampled customers who spent an average of at least 511 minutes online per day and sent an average of at least 7 emails per day from their ISP-provided email address, what is the sample proportion of those who churned?A) .078
B) .143
C) .200
D) .571
E) .778
Unlock Deck
Unlock for access to all 101 flashcards in this deck.
Unlock Deck
k this deck
58
An automobile finance company analyzed a sample of recent automobile loans to try to determine key factors in identifying borrowers who would be likely to default on their auto loan. The response variable Default equals 1 if the borrower defaulted during the term of the loan and 0 otherwise. The predictor variable AutoDebt% was the ratio (expressed as a percent) of the required loan payments to the borrower's take-home income at the time of purchase. JobTime was the number of years the borrower had worked at their current job at the time of purchase. CredScore was the borrower's credit score at the time of purchase. Below is part of the classification tree the finance company derived from the data collected in the study. Assume they classify those with a default probability estimate of at least .5 as Defaulters. Based on this classification tree, a member of the study sample who had a credit score of 802, been at their current job for 1 year, took out a loan with payments equaling 19% of their income, and defaulted would be
A) inaccurately classified as a Defaulter.
B) inaccurately classified as a non-Defaulter.
C) accurately classified as a Defaulter.
D) accurately classified as a non-Defaulter.
Based on this classification tree, a member of the study sample who had a credit score of 802, been at their current job for 1 year, took out a loan with payments equaling 19% of their income, and defaulted would beA) inaccurately classified as a Defaulter.
B) inaccurately classified as a non-Defaulter.
C) accurately classified as a Defaulter.
D) accurately classified as a non-Defaulter.
Unlock Deck
Unlock for access to all 101 flashcards in this deck.
Unlock Deck
k this deck
59
An automobile finance company analyzed a sample of recent automobile loans to try to determine key factors in identifying borrowers who would be likely to default on their auto loan. The response variable Default equals 1 if the borrower defaulted during the term of the loan and 0 otherwise. The predictor variable AutoDebt% was the ratio (expressed as a percent) of the required loan payments to the borrower's take-home income at the time of purchase. JobTime was the number of years the borrower had worked at their current job at the time of purchase. CredScore was the borrower's credit score at the time of purchase. Below is part of the classification tree the finance company derived from the data collected in the study. Assume they classify those with a default probability estimate of at least .5 as Defaulters. Based on this classification tree, a member of the study sample who had a credit score of 537, been at their current job for 12 years, took out a loan with payments equaling 16% of their income, and defaulted would be
A) inaccurately classified as a Defaulter.
B) inaccurately classified as a non-Defaulter.
C) accurately classified as a Defaulter.
D) accurately classified as a non-Defaulter.
Based on this classification tree, a member of the study sample who had a credit score of 537, been at their current job for 12 years, took out a loan with payments equaling 16% of their income, and defaulted would beA) inaccurately classified as a Defaulter.
B) inaccurately classified as a non-Defaulter.
C) accurately classified as a Defaulter.
D) accurately classified as a non-Defaulter.
Unlock Deck
Unlock for access to all 101 flashcards in this deck.
Unlock Deck
k this deck
60
An internet service provider (ISP) has randomly selected a sample of 223 observations concerning values of the response variable Churn and several predictor variables based on customer activity during the most recently billed month. Here Churn equals Yes if a customer churned-left the internet service provider for another ISP-and equals No otherwise. The predictor variable MinutesOn is the average daily minutes the customer spent online. EmailSent is the average daily number of emails the customer sent from the email address provided by the ISP. ServCalls is the number of times the customer called for service. Below is part of the classification tree they derived from the data collected in the study. Assume they classify those with a churn probability estimate (based on the sample proportion) of at least .5 as churners. Based on this classification tree, a member of the study sample who spent an average of 327 minutes online per day, sent an average of 4 emails per day from their ISP-provided email address, placed no service calls, and churned would be
A) inaccurately classified as a churner.
B) inaccurately classified as a non-churner.
C) accurately classified as a churner.
D) accurately classified as a non-churner.
Assume they classify those with a churn probability estimate (based on the sample proportion) of at least .5 as churners. Based on this classification tree, a member of the study sample who spent an average of 327 minutes online per day, sent an average of 4 emails per day from their ISP-provided email address, placed no service calls, and churned would beA) inaccurately classified as a churner.
B) inaccurately classified as a non-churner.
C) accurately classified as a churner.
D) accurately classified as a non-churner.
Unlock Deck
Unlock for access to all 101 flashcards in this deck.
Unlock Deck
k this deck
61
An automobile finance company analyzed a sample of recent automobile loans to try to determine key factors in identifying borrowers who would be likely to default on their auto loan. The response variable Default equals 1 if the borrower defaulted during the term of the loan and 0 otherwise. The predictor variable AutoDebt% was the ratio (expressed as a percent) of the required loan payments to the borrower's take-home income at the time of purchase. JobTime was the number of years the borrower had worked at their current job at the time of purchase. CredScore was the borrower's credit score at the time of purchase. Below is part of the classification tree the finance company derived from the data collected in the study. Assume they classify those with a default probability estimate of at least .5 as Defaulters. A potential borrower who has just started their current job would like to apply for a loan with payments equaling 17% of their income. To be approved for the loan they would need to be classified as a non-Defaulter. Of the following credit scores, which is the lowest this potential borrower could have to be approved for the loan?
A) 421
B) 724
C) 795
D) There is no credit score which would allow them to be classified as a non-Defaulter.
E) There is insufficient information to determine the minimum allowable credit score.
A potential borrower who has just started their current job would like to apply for a loan with payments equaling 17% of their income. To be approved for the loan they would need to be classified as a non-Defaulter. Of the following credit scores, which is the lowest this potential borrower could have to be approved for the loan?A) 421
B) 724
C) 795
D) There is no credit score which would allow them to be classified as a non-Defaulter.
E) There is insufficient information to determine the minimum allowable credit score.
Unlock Deck
Unlock for access to all 101 flashcards in this deck.
Unlock Deck
k this deck
62
An automobile finance company analyzed a sample of recent automobile loans to try to determine key factors in identifying borrowers who would be likely to default on their auto loan. The response variable Default equals 1 if the borrower defaulted during the term of the loan and 0 otherwise. The predictor variable AutoDebt% was the ratio (expressed as a percent) of the required loan payments to the borrower's take-home income at the time of purchase. JobTime was the number of years the borrower had worked at their current job at the time of purchase. CredScore was the borrower's credit score at the time of purchase. Below is part of the classification tree the finance company derived from the data collected in the study. Assume they classify those with a default probability estimate of at least .5 as Defaulters. A potential borrower who has been at their current job for 1 year would like to apply for a loan with payments equaling 21% of their income. To be approved for the loan they would need to be classified as a non-Defaulter. Of the following credit scores, which is the lowest this potential borrower could have to be approved for the loan?
A) 421
B) 723
C) 795
D) There is no credit score which would allow them to be classified as a non-Defaulter.
E) There is insufficient information to determine the minimum allowable credit score.
A potential borrower who has been at their current job for 1 year would like to apply for a loan with payments equaling 21% of their income. To be approved for the loan they would need to be classified as a non-Defaulter. Of the following credit scores, which is the lowest this potential borrower could have to be approved for the loan?A) 421
B) 723
C) 795
D) There is no credit score which would allow them to be classified as a non-Defaulter.
E) There is insufficient information to determine the minimum allowable credit score.
Unlock Deck
Unlock for access to all 101 flashcards in this deck.
Unlock Deck
k this deck
63
An MBA admissions officer wishes to predict an MBA applicant's grade point average (GPA) for the MBA program on the basis of the applicant's score on the Graduate Management Admission Test (GMAT) and their undergraduate GPA (UGPA). The admissions officer used a random sample of previously admitted applicants to build a regression tree that can be used to predict the MBA GPAs of future MBA students. Below is the final regression tree. Based on this regression tree, how many of the admitted applicants in the sample had a GMAT score of at least 650?
A) 381
B) 507
C) 1056
D) 1395
E) There is insufficient information to determine the answer.
Based on this regression tree, how many of the admitted applicants in the sample had a GMAT score of at least 650?A) 381
B) 507
C) 1056
D) 1395
E) There is insufficient information to determine the answer.
Unlock Deck
Unlock for access to all 101 flashcards in this deck.
Unlock Deck
k this deck
64
An automobile finance company analyzed a sample of recent automobile loans to try to determine key factors in identifying borrowers who would be likely to default on their auto loan. The response variable Default equals 1 if the borrower defaulted during the term of the loan and 0 otherwise. The predictor variable AutoDebt% was the ratio (expressed as a percent) of the required loan payments to the borrower's take-home income at the time of purchase. JobTime was the number of years the borrower had worked at their current job at the time of purchase. CredScore was the borrower's credit score at the time of purchase. Below is part of the classification tree the finance company derived from the data collected in the study. Assume they classify those with a default probability estimate of at least .5 as Defaulters. A potential borrower with a credit score of 792 who has been at their current job for 1 year and has a monthly income of $3,000 would like to apply for a loan. To be approved for the loan they would need to be classified as a non-Defaulter. Of the following monthly payments, which is the highest this loan could have to be approved for this potential borrower?
A) $381
B) $534
C) $595
D) None of these monthly payments would allow them to be classified as a non-Defaulter.
E) There is insufficient information to determine the maximum allowable monthly payment.
A potential borrower with a credit score of 792 who has been at their current job for 1 year and has a monthly income of $3,000 would like to apply for a loan. To be approved for the loan they would need to be classified as a non-Defaulter. Of the following monthly payments, which is the highest this loan could have to be approved for this potential borrower?A) $381
B) $534
C) $595
D) None of these monthly payments would allow them to be classified as a non-Defaulter.
E) There is insufficient information to determine the maximum allowable monthly payment.
Unlock Deck
Unlock for access to all 101 flashcards in this deck.
Unlock Deck
k this deck
65
An automobile finance company analyzed a sample of recent automobile loans to try to determine key factors in identifying borrowers who would be likely to default on their auto loan. The response variable Default equals 1 if the borrower defaulted during the term of the loan and 0 otherwise. The predictor variable AutoDebt% was the ratio (expressed as a percent) of the required loan payments to the borrower's take-home income at the time of purchase. JobTime was the number of years the borrower had worked at their current job at the time of purchase. CredScore was the borrower's credit score at the time of purchase. Below is part of the classification tree the finance company derived from the data collected in the study. Assume they classify those with a default probability estimate of at least .5 as Defaulters. A potential borrower with a credit score of 723 who has been at their current job for 7 years is applying for a loan with payments equaling 11% of their income. Based on this classification tree, the best estimate of the probability that this loan applicant would default would be ________.
A) .000
B) .077
C) .181
D) .761
E) 1.000
A potential borrower with a credit score of 723 who has been at their current job for 7 years is applying for a loan with payments equaling 11% of their income. Based on this classification tree, the best estimate of the probability that this loan applicant would default would be ________.A) .000
B) .077
C) .181
D) .761
E) 1.000
Unlock Deck
Unlock for access to all 101 flashcards in this deck.
Unlock Deck
k this deck
66
An automobile finance company analyzed a sample of recent automobile loans to try to determine key factors in identifying borrowers who would be likely to default on their auto loan. The response variable Default equals 1 if the borrower defaulted during the term of the loan and 0 otherwise. The predictor variable AutoDebt% was the ratio (expressed as a percent) of the required loan payments to the borrower's take-home income at the time of purchase. JobTime was the number of years the borrower had worked at their current job at the time of purchase. CredScore was the borrower's credit score at the time of purchase. Below is part of the classification tree the finance company derived from the data collected in the study. Assume they classify those with a default probability estimate of at least .5 as Defaulters. A potential borrower with a credit score of 724 who has been at their current job for 3 years and has a monthly salary of $6,000 would like to apply for a loan. To be approved for the loan they would need to be classified as a non-Defaulter. Of the following monthly payments, which is the highest this loan could have to be approved for this potential borrower?
A) $591
B) $964
C) $1,295
D) None of these monthly payments would allow them to be classified as a non-Defaulter.
E) There is insufficient information to determine the maximum allowable monthly payment.
A potential borrower with a credit score of 724 who has been at their current job for 3 years and has a monthly salary of $6,000 would like to apply for a loan. To be approved for the loan they would need to be classified as a non-Defaulter. Of the following monthly payments, which is the highest this loan could have to be approved for this potential borrower?A) $591
B) $964
C) $1,295
D) None of these monthly payments would allow them to be classified as a non-Defaulter.
E) There is insufficient information to determine the maximum allowable monthly payment.
Unlock Deck
Unlock for access to all 101 flashcards in this deck.
Unlock Deck
k this deck
67
An automobile finance company analyzed a sample of recent automobile loans to try to determine key factors in identifying borrowers who would be likely to default on their auto loan. The response variable Default equals 1 if the borrower defaulted during the term of the loan and 0 otherwise. The predictor variable AutoDebt% was the ratio (expressed as a percent) of the required loan payments to the borrower's take-home income at the time of purchase. JobTime was the number of years the borrower had worked at their current job at the time of purchase. CredScore was the borrower's credit score at the time of purchase. Below is part of the classification tree the finance company derived from the data collected in the study. Assume they classify those with a default probability estimate of at least .5 as Defaulters. A potential borrower with a credit score of 724 who has been at their current job for 6 years is applying for a loan with payments equaling 21% of their income. Based on this classification tree, the best estimate of the probability that this loan applicant would default would be
A) .000
B) .123
C) .181
D) .891
E) 1.000
A potential borrower with a credit score of 724 who has been at their current job for 6 years is applying for a loan with payments equaling 21% of their income. Based on this classification tree, the best estimate of the probability that this loan applicant would default would beA) .000
B) .123
C) .181
D) .891
E) 1.000
Unlock Deck
Unlock for access to all 101 flashcards in this deck.
Unlock Deck
k this deck
68
An MBA admissions officer wishes to predict an MBA applicant's grade point average (GPA) for the MBA program on the basis of the applicant's score on the Graduate Management Admission Test (GMAT) and their undergraduate GPA (UGPA). The admissions officer used a random sample of previously admitted applicants to build a regression tree that can be used to predict the MBA GPAs of future MBA students. Below is the final regression tree. Based on this regression tree, how many of the admitted applicants in the sample had both a GMAT score of at least 740 and an undergraduate GPA of at least 3.87?
A) 129
B) 252
C) 381
D) 510
E) There is insufficient information to determine the answer.
Based on this regression tree, how many of the admitted applicants in the sample had both a GMAT score of at least 740 and an undergraduate GPA of at least 3.87?A) 129
B) 252
C) 381
D) 510
E) There is insufficient information to determine the answer.
Unlock Deck
Unlock for access to all 101 flashcards in this deck.
Unlock Deck
k this deck
69
An automobile finance company analyzed a sample of recent automobile loans to try to determine key factors in identifying borrowers who would be likely to default on their auto loan. The response variable Default equals 1 if the borrower defaulted during the term of the loan and 0 otherwise. The predictor variable AutoDebt% was the ratio (expressed as a percent) of the required loan payments to the borrower's take-home income at the time of purchase. JobTime was the number of years the borrower had worked at their current job at the time of purchase. CredScore was the borrower's credit score at the time of purchase. Below is part of the classification tree the finance company derived from the data collected in the study. Assume they classify those with a default probability estimate of at least .5 as Defaulters. A potential borrower with a credit score of 668 who has just started their current job is applying for a loan with payments equaling 7% of their income. Based on this classification tree, the best estimate of the probability that this loan applicant would default would be ________.
A) .000
B) .181
C) .239
D) .867
E) 1.000
A potential borrower with a credit score of 668 who has just started their current job is applying for a loan with payments equaling 7% of their income. Based on this classification tree, the best estimate of the probability that this loan applicant would default would be ________.A) .000
B) .181
C) .239
D) .867
E) 1.000
Unlock Deck
Unlock for access to all 101 flashcards in this deck.
Unlock Deck
k this deck
70
An automobile finance company analyzed a sample of recent automobile loans to try to determine key factors in identifying borrowers who would be likely to default on their auto loan. The response variable Default equals 1 if the borrower defaulted during the term of the loan and 0 otherwise. The predictor variable AutoDebt% was the ratio (expressed as a percent) of the required loan payments to the borrower's take-home income at the time of purchase. JobTime was the number of years the borrower had worked at their current job at the time of purchase. CredScore was the borrower's credit score at the time of purchase. Below is part of the classification tree the finance company derived from the data collected in the study. Assume they classify those with a default probability estimate of at least .5 as Defaulters. A potential borrower with a credit score of 752 who just started their current job is applying for a loan with payments equaling 19% of their income. Based on this classification tree, the best estimate of the probability that this loan applicant would default would be
A) .000
B) .077
C) .253
D) .747
E) 1.000
A potential borrower with a credit score of 752 who just started their current job is applying for a loan with payments equaling 19% of their income. Based on this classification tree, the best estimate of the probability that this loan applicant would default would beA) .000
B) .077
C) .253
D) .747
E) 1.000
Unlock Deck
Unlock for access to all 101 flashcards in this deck.
Unlock Deck
k this deck
71
An automobile finance company analyzed a sample of recent automobile loans to try to determine key factors in identifying borrowers who would be likely to default on their auto loan. The response variable Default equals 1 if the borrower defaulted during the term of the loan and 0 otherwise. The predictor variable AutoDebt% was the ratio (expressed as a percent) of the required loan payments to the borrower's take-home income at the time of purchase. JobTime was the number of years the borrower had worked at their current job at the time of purchase. CredScore was the borrower's credit score at the time of purchase. Below is part of the classification tree the finance company derived from the data collected in the study. Assume they classify those with a default probability estimate of at least .5 as Defaulters. A potential borrower with a credit score of 743 who has been at their current job for 3 years is applying for a loan with payments equaling 12% of their income. Based on this classification tree, the best estimate of the probability that this loan applicant would default would be
A) .000
B) .077
C) .123
D) .923
E) 1.000
A potential borrower with a credit score of 743 who has been at their current job for 3 years is applying for a loan with payments equaling 12% of their income. Based on this classification tree, the best estimate of the probability that this loan applicant would default would beA) .000
B) .077
C) .123
D) .923
E) 1.000
Unlock Deck
Unlock for access to all 101 flashcards in this deck.
Unlock Deck
k this deck
72
An MBA admissions officer wishes to predict an MBA applicant's grade point average (GPA) for the MBA program on the basis of the applicant's score on the Graduate Management Admission Test (GMAT) and their undergraduate GPA (UGPA). The admissions officer used a random sample of previously admitted applicants to build a regression tree that can be used to predict the MBA GPAs of future MBA students. Below is the final regression tree. Based on this regression tree, how many of the admitted applicants in the sample had a GMAT score of less than 650?
A) 96
B) 453
C) 507
D) 549
E) There is insufficient information to determine the answer.
Based on this regression tree, how many of the admitted applicants in the sample had a GMAT score of less than 650?A) 96
B) 453
C) 507
D) 549
E) There is insufficient information to determine the answer.
Unlock Deck
Unlock for access to all 101 flashcards in this deck.
Unlock Deck
k this deck
73
An automobile finance company analyzed a sample of recent automobile loans to try to determine key factors in identifying borrowers who would be likely to default on their auto loan. The response variable Default equals 1 if the borrower defaulted during the term of the loan and 0 otherwise. The predictor variable AutoDebt% was the ratio (expressed as a percent) of the required loan payments to the borrower's take-home income at the time of purchase. JobTime was the number of years the borrower had worked at their current job at the time of purchase. CredScore was the borrower's credit score at the time of purchase. Below is part of the classification tree the finance company derived from the data collected in the study. Assume they classify those with a default probability estimate of at least .5 as Defaulters. A potential borrower with a credit score of 523 who has been at their current job for 1 year is applying for a loan with payments equaling 17% of their income. Based on this classification tree, the best estimate of the probability that this loan applicant would default would be
A) .000
B) .239
C) .761
D) .867
E) 1.000
A potential borrower with a credit score of 523 who has been at their current job for 1 year is applying for a loan with payments equaling 17% of their income. Based on this classification tree, the best estimate of the probability that this loan applicant would default would beA) .000
B) .239
C) .761
D) .867
E) 1.000
Unlock Deck
Unlock for access to all 101 flashcards in this deck.
Unlock Deck
k this deck
74
An automobile finance company analyzed a sample of recent automobile loans to try to determine key factors in identifying borrowers who would be likely to default on their auto loan. The response variable Default equals 1 if the borrower defaulted during the term of the loan and 0 otherwise. The predictor variable AutoDebt% was the ratio (expressed as a percent) of the required loan payments to the borrower's take-home income at the time of purchase. JobTime was the number of years the borrower had worked at their current job at the time of purchase. CredScore was the borrower's credit score at the time of purchase. Below is part of the classification tree the finance company derived from the data collected in the study. Assume they classify those with a default probability estimate of at least .5 as Defaulters. A potential borrower with a credit score of 503 who has been at their current job for 4 years and has a monthly income of $4,700 would like to apply for a loan. To be approved for the loan they would need to be classified as a non-Defaulter. Of the following monthly payments, which is the highest this loan could have to be approved for this potential borrower?
A) $481
B) $734
C) $1,295
D) None of these monthly payments would allow them to be classified as a non-Defaulter.
E) There is insufficient information to determine the maximum allowable monthly payment.
A potential borrower with a credit score of 503 who has been at their current job for 4 years and has a monthly income of $4,700 would like to apply for a loan. To be approved for the loan they would need to be classified as a non-Defaulter. Of the following monthly payments, which is the highest this loan could have to be approved for this potential borrower?A) $481
B) $734
C) $1,295
D) None of these monthly payments would allow them to be classified as a non-Defaulter.
E) There is insufficient information to determine the maximum allowable monthly payment.
Unlock Deck
Unlock for access to all 101 flashcards in this deck.
Unlock Deck
k this deck
75
An automobile finance company analyzed a sample of recent automobile loans to try to determine key factors in identifying borrowers who would be likely to default on their auto loan. The response variable Default equals 1 if the borrower defaulted during the term of the loan and 0 otherwise. The predictor variable AutoDebt% was the ratio (expressed as a percent) of the required loan payments to the borrower's take-home income at the time of purchase. JobTime was the number of years the borrower had worked at their current job at the time of purchase. CredScore was the borrower's credit score at the time of purchase. Below is part of the classification tree the finance company derived from the data collected in the study. Assume they classify those with a default probability estimate of at least .5 as Defaulters. A potential borrower with a credit score of 600 who has just started their current job with a monthly salary of $5,000 would like to apply for a loan. To be approved for the loan they would need to be classified as a non-Defaulter. Of the following monthly payments, which is the highest this loan could have to be approved for this potential borrower?
A) $595
B) $674
C) $795
D) None of these monthly payments would allow them to be classified as a non-Defaulter.
E) There is insufficient information to determine the maximum allowable monthly payment.
A potential borrower with a credit score of 600 who has just started their current job with a monthly salary of $5,000 would like to apply for a loan. To be approved for the loan they would need to be classified as a non-Defaulter. Of the following monthly payments, which is the highest this loan could have to be approved for this potential borrower?A) $595
B) $674
C) $795
D) None of these monthly payments would allow them to be classified as a non-Defaulter.
E) There is insufficient information to determine the maximum allowable monthly payment.
Unlock Deck
Unlock for access to all 101 flashcards in this deck.
Unlock Deck
k this deck
76
An MBA admissions officer wishes to predict an MBA applicant's grade point average (GPA) for the MBA program on the basis of the applicant's score on the Graduate Management Admission Test (GMAT) and their undergraduate GPA (UGPA). The admissions officer used a random sample of previously admitted applicants to build a regression tree that can be used to predict the MBA GPAs of future MBA students. Below is the final regression tree. Based on this regression tree, how many of the admitted applicants in the sample had a GMAT score of at least 740?
A) 129
B) 252
C) 381
D) 510
E) There is insufficient information to determine the answer.
Based on this regression tree, how many of the admitted applicants in the sample had a GMAT score of at least 740?A) 129
B) 252
C) 381
D) 510
E) There is insufficient information to determine the answer.
Unlock Deck
Unlock for access to all 101 flashcards in this deck.
Unlock Deck
k this deck
77
An MBA admissions officer wishes to predict an MBA applicant's grade point average (GPA) for the MBA program on the basis of the applicant's score on the Graduate Management Admission Test (GMAT) and their undergraduate GPA (UGPA). The admissions officer used a random sample of previously admitted applicants to build a regression tree that can be used to predict the MBA GPAs of future MBA students. Below is the final regression tree. Based on this regression tree, what proportion of the admitted applicants in the sample had both a GMAT score of at least 740 and an undergraduate GPA of at least 3.87?
A) .512
B) .339
C) .254
D) .122
E) There is insufficient information to determine the answer.
Based on this regression tree, what proportion of the admitted applicants in the sample had both a GMAT score of at least 740 and an undergraduate GPA of at least 3.87?A) .512
B) .339
C) .254
D) .122
E) There is insufficient information to determine the answer.
Unlock Deck
Unlock for access to all 101 flashcards in this deck.
Unlock Deck
k this deck
78
An automobile finance company analyzed a sample of recent automobile loans to try to determine key factors in identifying borrowers who would be likely to default on their auto loan. The response variable Default equals 1 if the borrower defaulted during the term of the loan and 0 otherwise. The predictor variable AutoDebt% was the ratio (expressed as a percent) of the required loan payments to the borrower's take-home income at the time of purchase. JobTime was the number of years the borrower had worked at their current job at the time of purchase. CredScore was the borrower's credit score at the time of purchase. Below is part of the classification tree the finance company derived from the data collected in the study. Assume they classify those with a default probability estimate of at least .5 as Defaulters. A potential borrower who has been at their current job for 16 years would like to apply for a loan. To be approved for the loan they would need to be classified as a non-Defaulter. Of the following credit scores, which is the lowest this potential borrower could have to be approved for the loan?
A) 421
B) 724
C) 795
D) There is no credit score which would allow them to be classified as a non-Defaulter.
E) There is insufficient information to determine the minimum allowable credit score.
A potential borrower who has been at their current job for 16 years would like to apply for a loan. To be approved for the loan they would need to be classified as a non-Defaulter. Of the following credit scores, which is the lowest this potential borrower could have to be approved for the loan?A) 421
B) 724
C) 795
D) There is no credit score which would allow them to be classified as a non-Defaulter.
E) There is insufficient information to determine the minimum allowable credit score.
Unlock Deck
Unlock for access to all 101 flashcards in this deck.
Unlock Deck
k this deck
79
An automobile finance company analyzed a sample of recent automobile loans to try to determine key factors in identifying borrowers who would be likely to default on their auto loan. The response variable Default equals 1 if the borrower defaulted during the term of the loan and 0 otherwise. The predictor variable AutoDebt% was the ratio (expressed as a percent) of the required loan payments to the borrower's take-home income at the time of purchase. JobTime was the number of years the borrower had worked at their current job at the time of purchase. CredScore was the borrower's credit score at the time of purchase. Below is part of the classification tree the finance company derived from the data collected in the study. Assume they classify those with a default probability estimate of at least .5 as Defaulters. A potential borrower with a credit score of 717 who has been at their current job for 3 years is considering applying for a loan. They do not yet have a particular loan amount in mind. Based on this classification tree, the best estimate that this loan applicant would default would be ________.
A) .000
B) .347
C) .552
D) .867
E) 1.000
A potential borrower with a credit score of 717 who has been at their current job for 3 years is considering applying for a loan. They do not yet have a particular loan amount in mind. Based on this classification tree, the best estimate that this loan applicant would default would be ________.A) .000
B) .347
C) .552
D) .867
E) 1.000
Unlock Deck
Unlock for access to all 101 flashcards in this deck.
Unlock Deck
k this deck
80
An automobile finance company analyzed a sample of recent automobile loans to try to determine key factors in identifying borrowers who would be likely to default on their auto loan. The response variable Default equals 1 if the borrower defaulted during the term of the loan and 0 otherwise. The predictor variable AutoDebt% was the ratio (expressed as a percent) of the required loan payments to the borrower's take-home income at the time of purchase. JobTime was the number of years the borrower had worked at their current job at the time of purchase. CredScore was the borrower's credit score at the time of purchase. Below is part of the classification tree the finance company derived from the data collected in the study. Assume they classify those with a default probability estimate of at least .5 as Defaulters. A potential borrower with a credit score of 812 and a monthly income of $4,000 would like to apply for a loan. To be approved for the loan they would need to be classified as a non-Defaulter. Of the following monthly payments, which is the highest this loan could have to be approved for this potential borrower?
A) $481
B) $634
C) $995
D) None of these monthly payments would allow them to be classified as a non-Defaulter.
E) There is insufficient information to determine the maximum allowable monthly payment.
A potential borrower with a credit score of 812 and a monthly income of $4,000 would like to apply for a loan. To be approved for the loan they would need to be classified as a non-Defaulter. Of the following monthly payments, which is the highest this loan could have to be approved for this potential borrower?A) $481
B) $634
C) $995
D) None of these monthly payments would allow them to be classified as a non-Defaulter.
E) There is insufficient information to determine the maximum allowable monthly payment.
Unlock Deck
Unlock for access to all 101 flashcards in this deck.
Unlock Deck
k this deck
Unlock Deck
Unlock for access to all 101 flashcards in this deck.


